
The completion of a single Milestone / Task depends on a series of predecessor tasks or constraints that must be completed first. It is therefore important to be able to analyze the sequence and volume of tasks that constraint work. For a given Milestone / Task, Constraint Network Analysis does this by exposing a network of constraints enabling you to answer the question, “What are all the tasks that would have to be completed to get to that certain Milestone / Task completed?” It will expose what a Milestone / Task is driven by (not what a Milestone / Task drives). Constraint Network Analysis depicts all paths (rather than a single path) leading to the selected Milestone / Task. Basically, if a team desires to start a given task, they will have to work first on all constraint tasks.
Constraints Network Analysis is available in SPS|PM in the Lookahead view and Gantt Charter view. To access Constraints Network Analysis, use one of the following methods:
Method 1: Lookahead View
To access Constraints Network Analysis from the Lookahead view, complete the steps below:
- From the Main Navigation Bar select Lookahead, then select Task List.
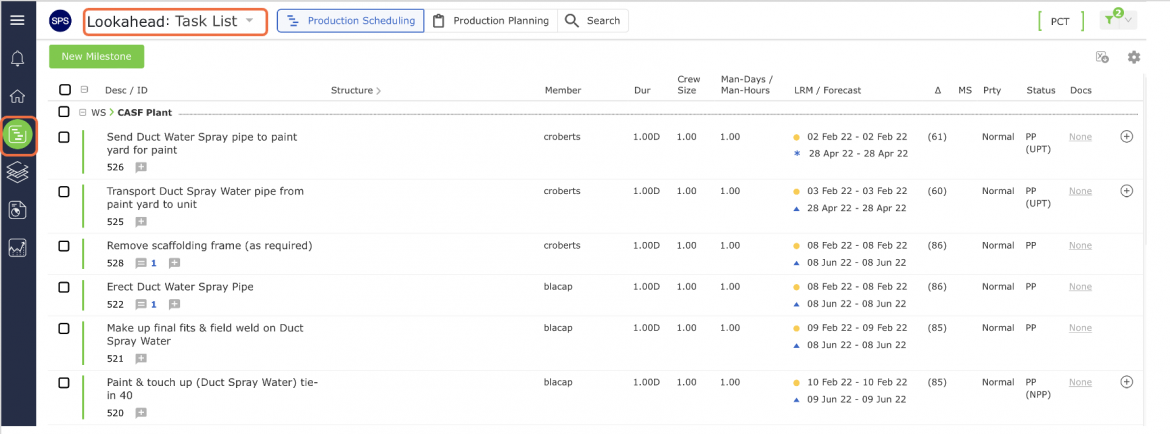
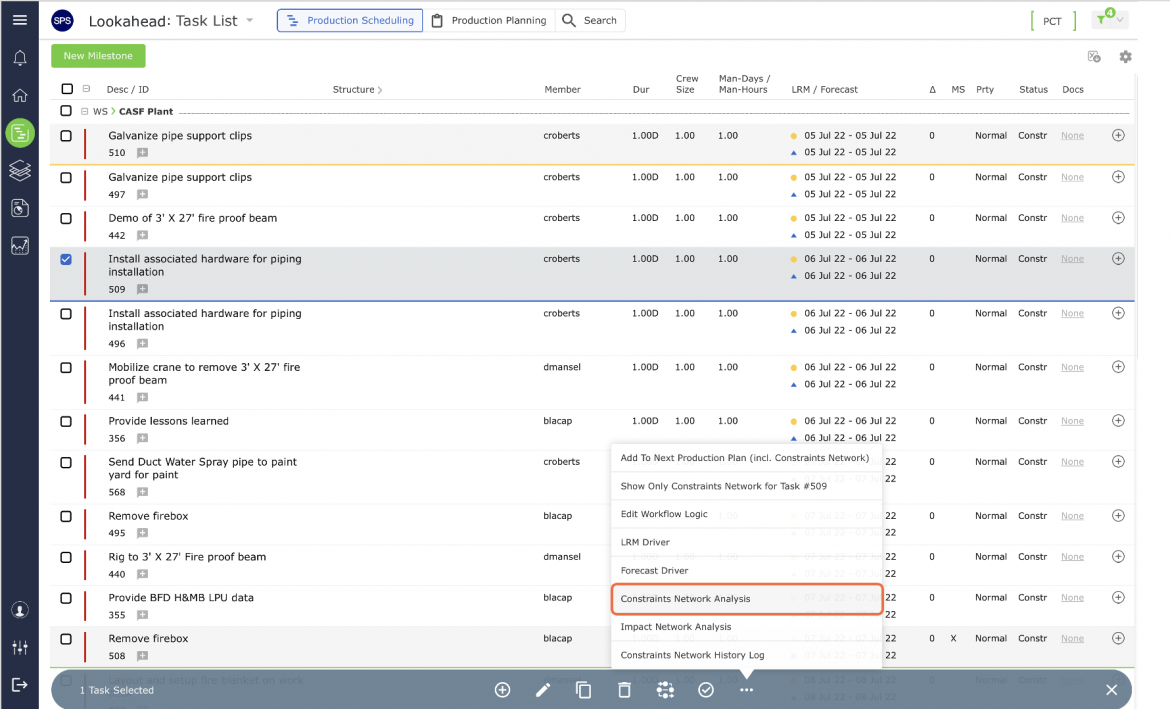
- From the Lookahead view, select the desired Milestone / Task by clicking once anywhere on the Milestone / Task Once selected, the task row will display a blue underline, then from the Floating Menu select Constraints Network Analysis.
Note: If the selected Milestone / Task does not have any predecessors (is constraint-free), Constraint Network Analysis will automatically be disabled.
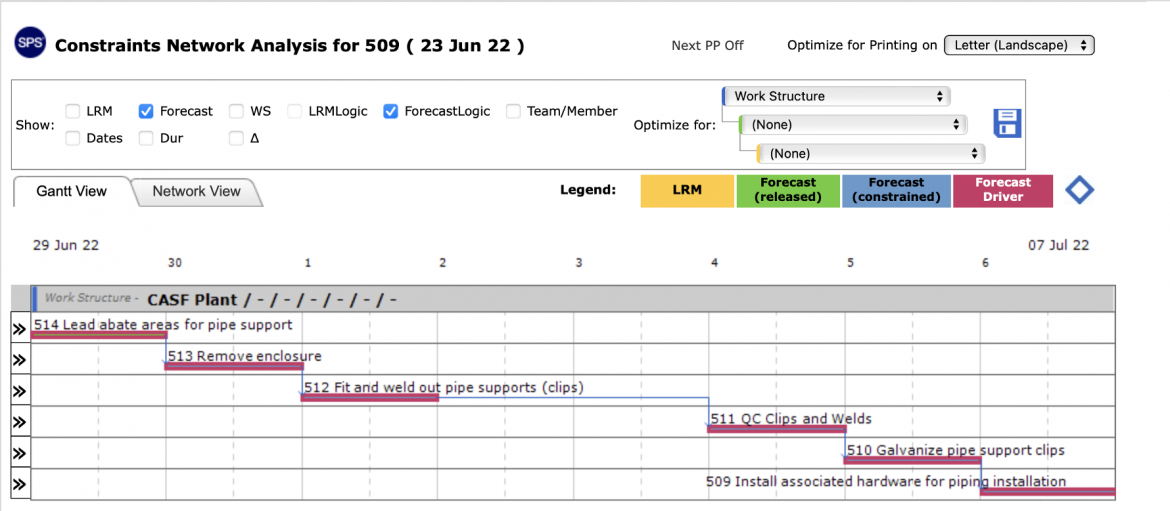
- Constraints Network Analysis will open in a new window and display the Milestones / Tasks that would have to be completed to get to the selected Milestone / Task completed.
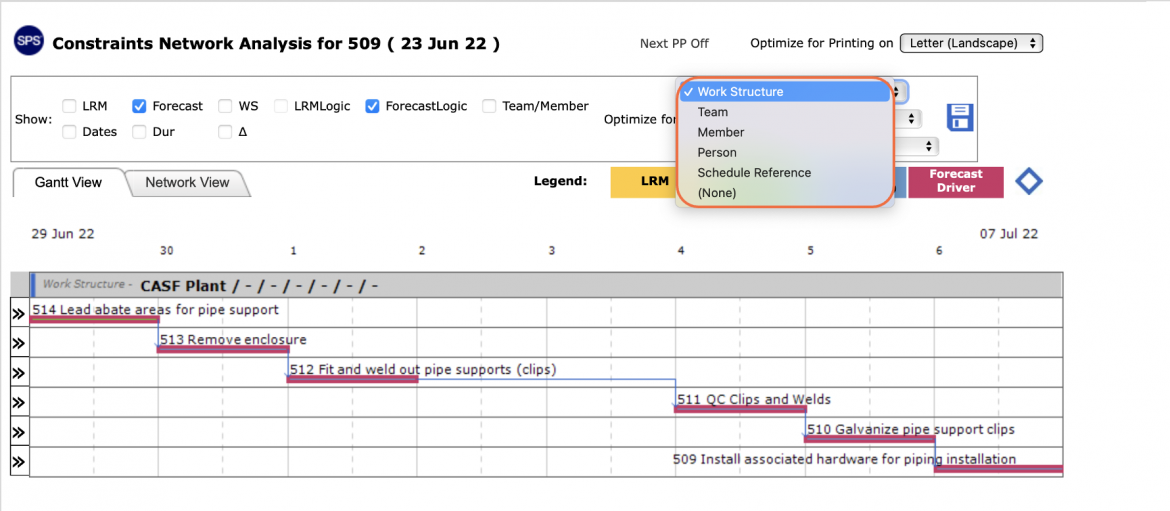
- The attributes shown on Constraints Network Analysis can be limited by filtering by: LRM, Forecast, Work Structure, LRM logic, forecast logic, team and team member, dates, and duration. Additionally, data can be visualized by the available Work Structure by selecting: Optimize For.
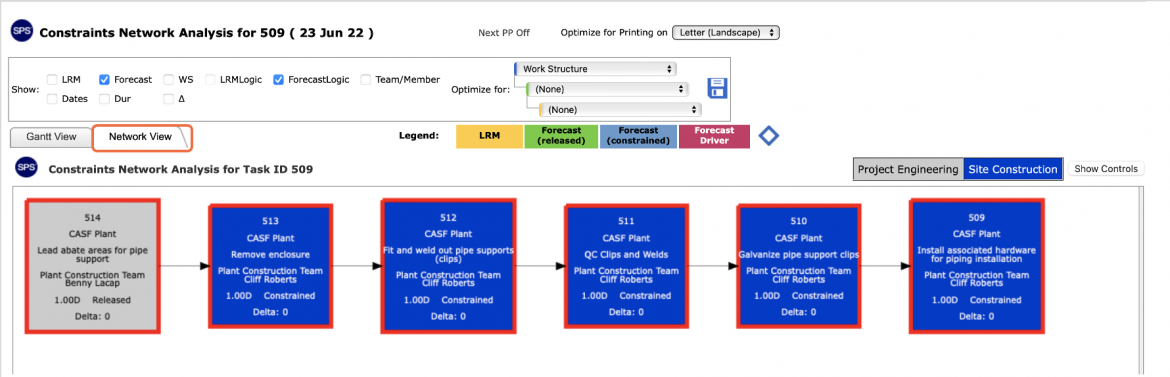
- Constraints Network Analysis default display is the Gantt view but can also be viewed in Network Manager view by clicking the Network View tab.
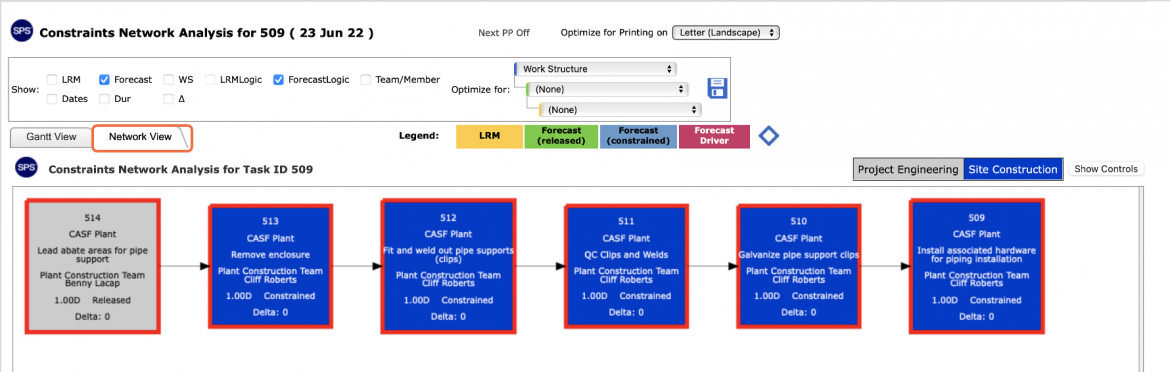
Method 2: Gantt Charter View
To access Constraints Network Analysis from the Gantt Charter view, complete the steps below:
- From the Lookahead dropdown list select Gantt Chart.
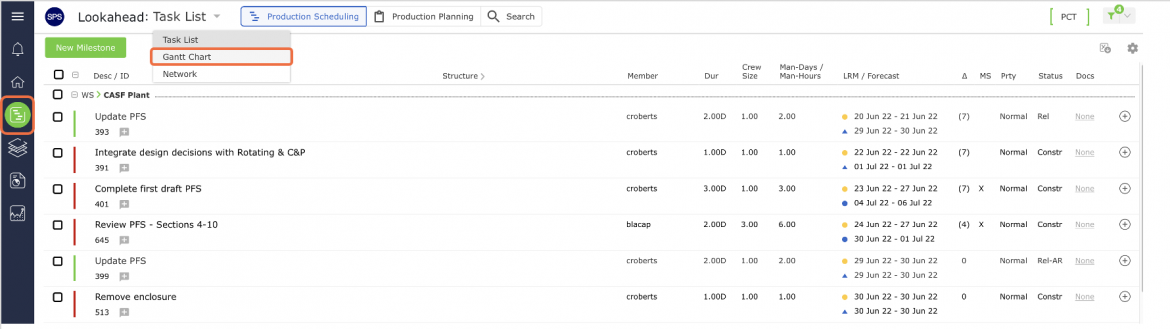
- From the Lookahead view, select the desired Milestone / Task by clicking once anywhere on the Milestone / Task Once selected, the task row will display a blue underline, then from the Floating Menu select Constraints Network Analysis.
Note: If the selected Milestone / Task does not have any predecessors (is constraint-free), Constraint Network Analysis will automatically be disabled.
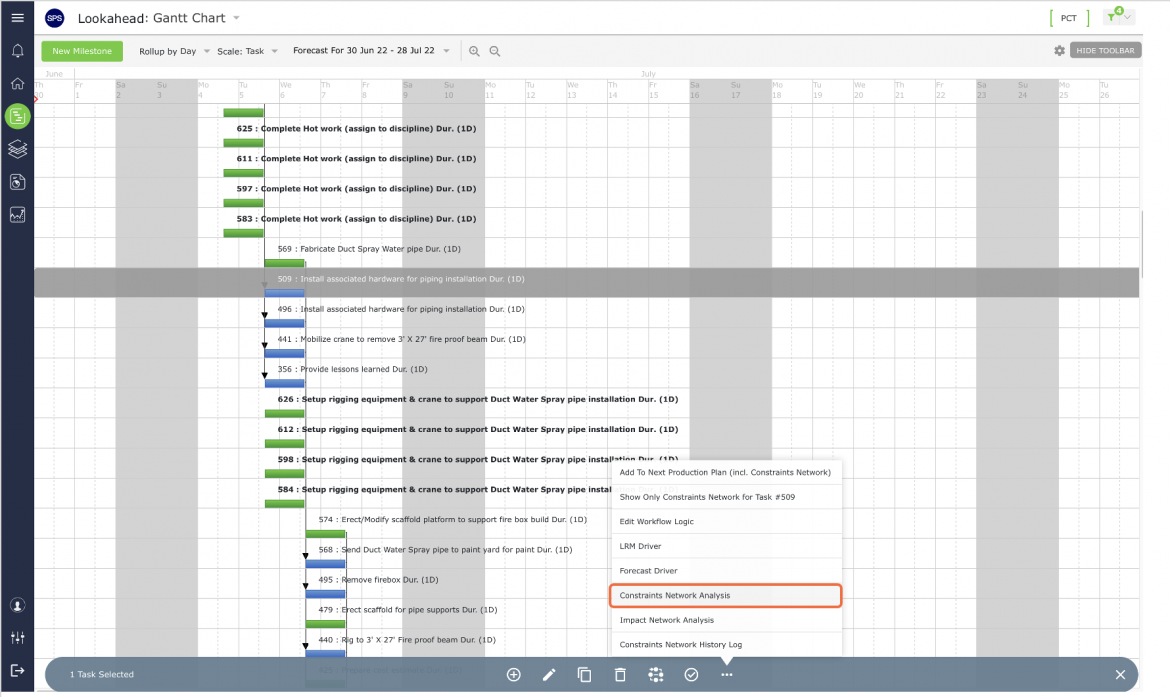
- Constraints Network Analysis will open in a new window and display the Milestones / Tasks that would have to be completed to get to the selected Milestone / Task completed.
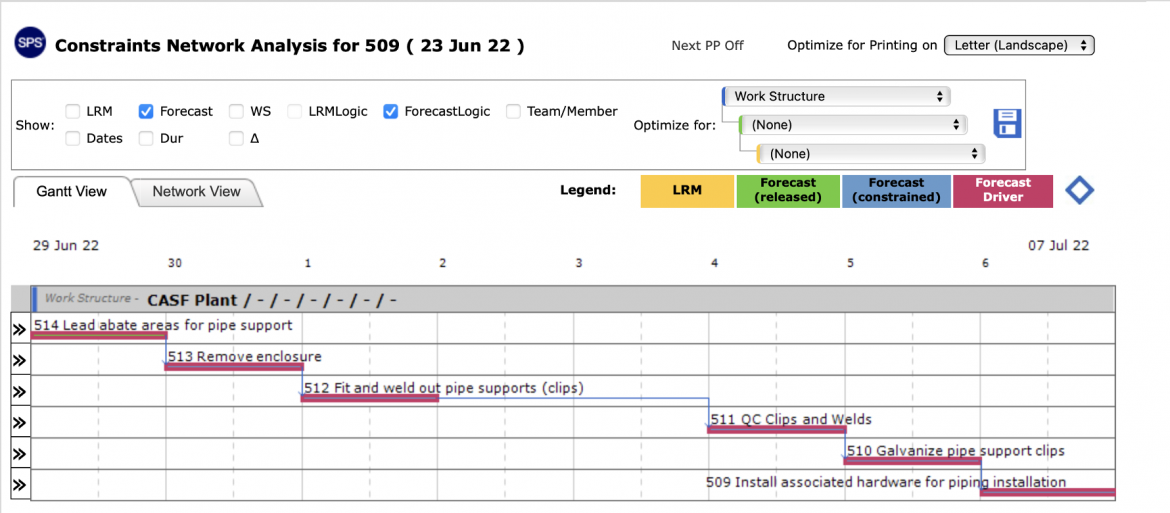
- The attributes shown on Constraints Network Analysis can be limited by filtering by: LRM, Forecast, Work Structure, LRM logic, forecast logic, team and team member, dates, and duration. Additionally, data can be visualized by the available Work Structure by selecting: Optimize For.
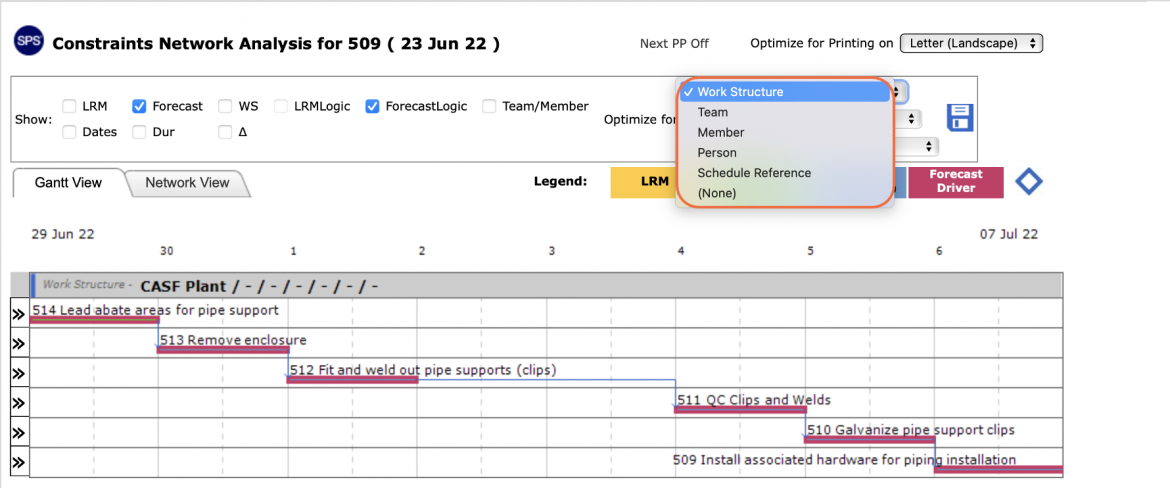
- Constraints Network Analysis default display is the Gantt view but can also be viewed in Network Manager view by clicking the Network View tab.
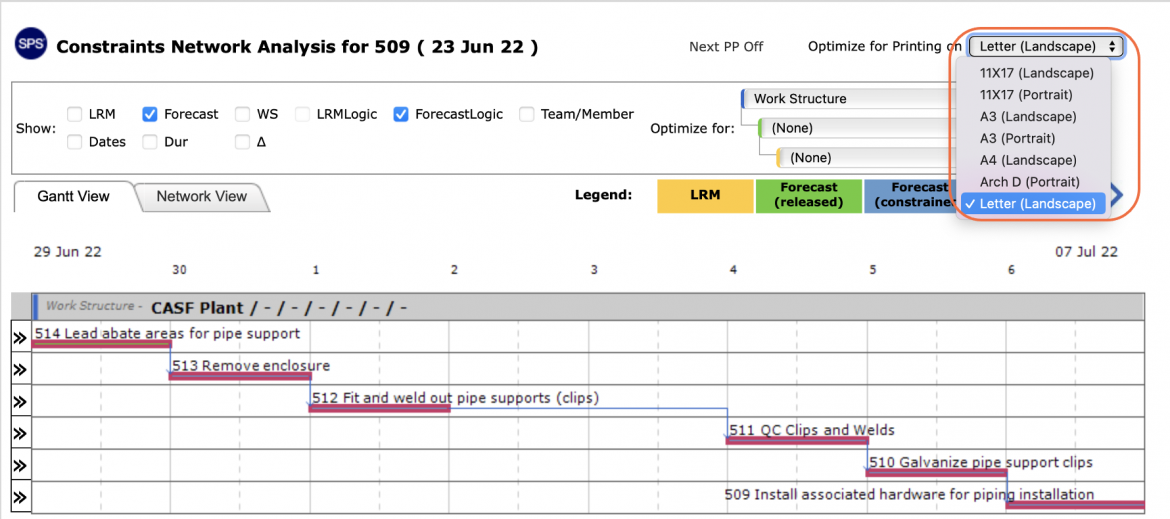
- To print Constraints Network Analysis, select the desired paper size / orientation under: Optimize for Printing on.
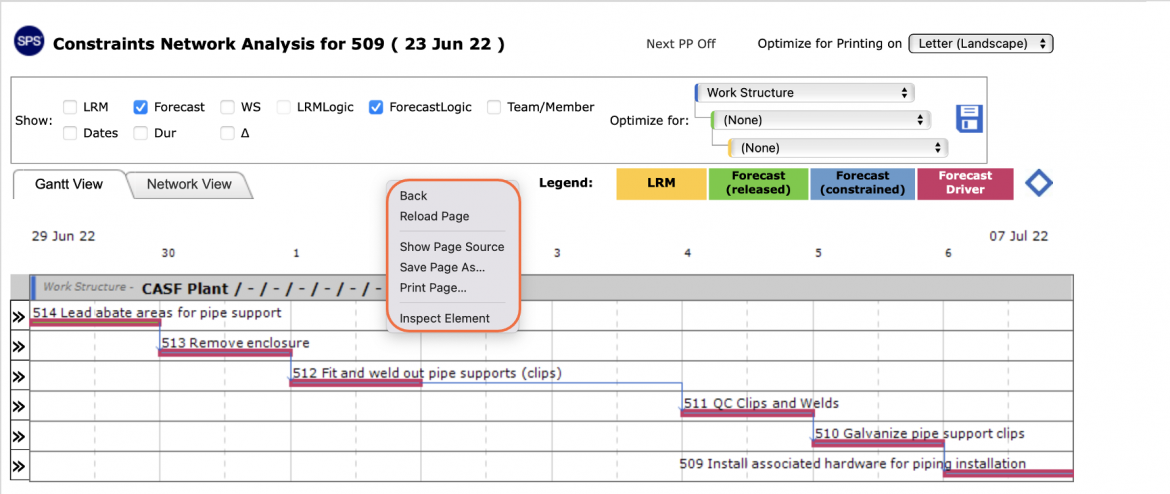
- Access to Print menu options may differ based on your browser. For instance, if you are using Internet Explorer, right-click in the white space outside of Constraints Network Analysis and select Print from the menu or simultaneously press the Ctrl and P keys on your keyboard.
- The Print Dialogue box opens.
- Using the Print Dialogue box, change any desired print settings. Once all relevant printing settings have been modified, click the Print button.
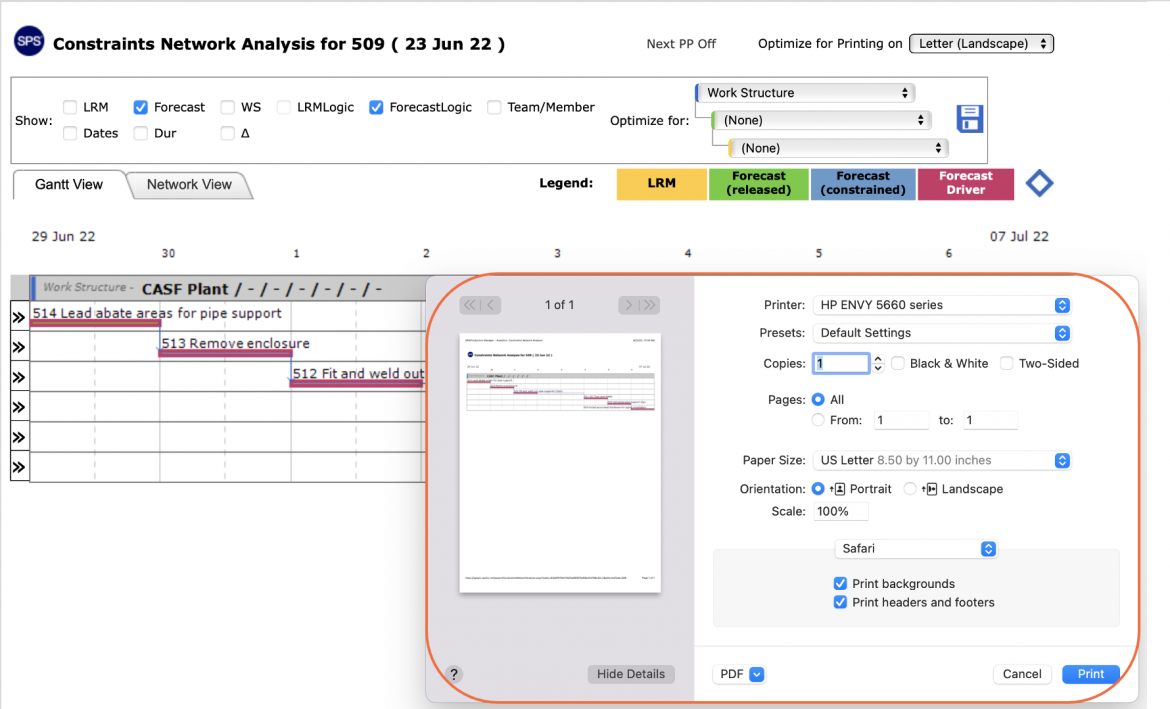
Note: Before printing, it is recommended you confirm the fit to the desired paper size.