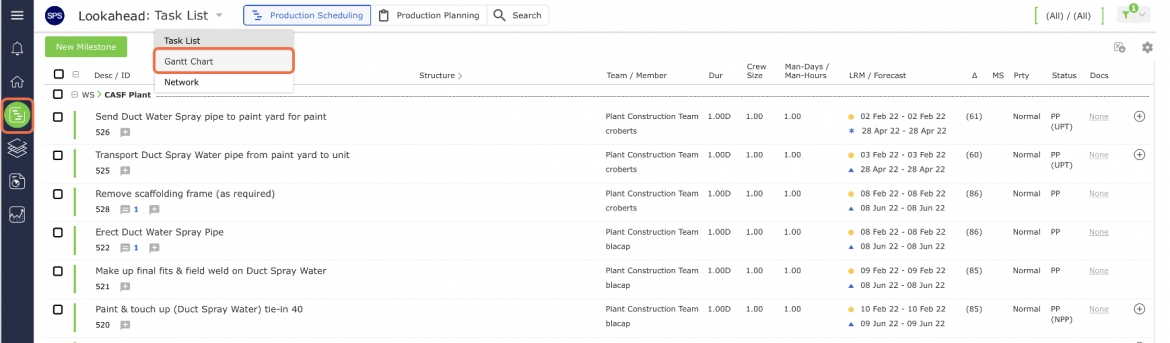
The Lookahead (Gantt Chart) view enables better visualization, adjustment, and commitment of work through the Gantt Chart interface. It is accessed by selecting Lookahead from the Main Navigation Bar and then choosing Gantt Chart from the Lookahead drop-down list as shown in the image below.
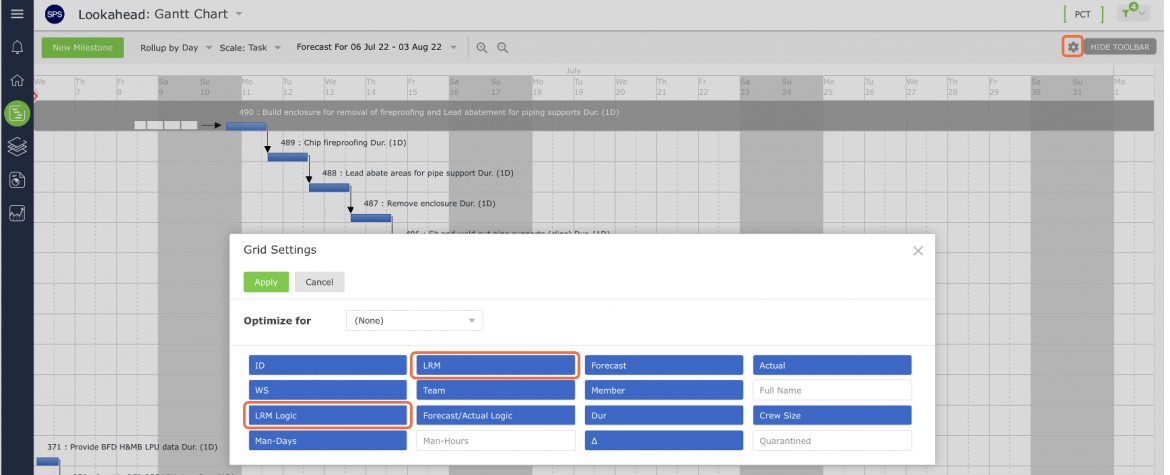
The LRM, Forecast, and Actual dates are plotted for all tasks in the work stream, but each set of dates can be hidden using the deselecting attributes within Grid Settings as shown in the image below.
Note: the Actual bar will only appear on the chart if the task has been completed.
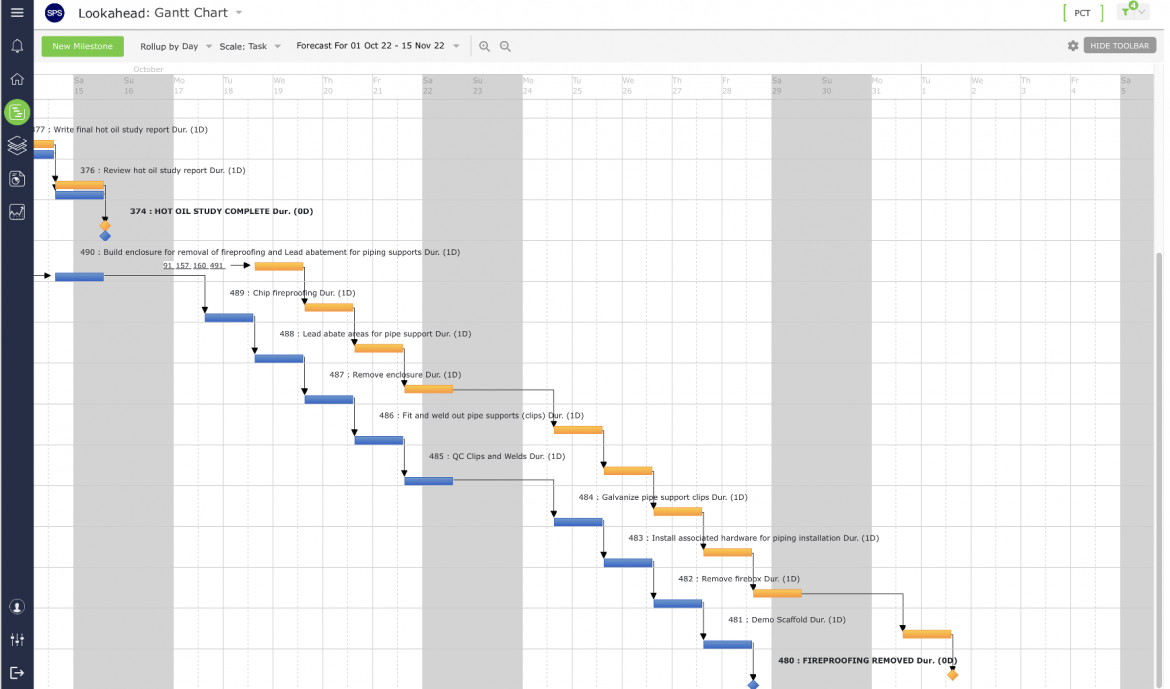
Arrows connecting the bars denote linkages between tasks in the work stream. Any linked tasks not plotted on the chart are represented by their Task ID’s. Any task on the Current Production Plan will be outlined in red and appended with “(PP)” after the task description and any other displayed attributes. Likewise, tasks on the Next Production Plan will be appended with “(NPP).” The work streams shown on the report can be limited by filtering by: task dates (LRM, Forecast, or Actual), Work Structure, team, team member, discipline / trade, company, and task status. Sorting options are also available. The Lookahead (Gantt Chart) view can also be rolled up to any level of the work stream to allow users to view the progress of the entire value stream, the progress of a specific work stream, etc.
Constraint Task ID’s are color-coded to reflect current status as shown in the image below. Red indicates the task is constrained, Gray indicates the task is completed and Green indicates the task is released. The Controls appear at the bottom of the window. The Controls allow you to edit and review the Production Schedule. It is important to remember that some Controls are only enabled if a task is selected.