
Understanding labor capacity requirements (knowledge or craft) for upcoming work and determining if the available labor capacity is enough to address workload is critical to ensure that workflows are as planned. Also, leveling labor capacity over time is a constant concern for those in charge of managing the execution of work. Labor capacity forecasts are obtained by assigning the crew size to every single task in Production Schedules. Together with task durations, defining crew size requirements determines the amount of Man-Days or Man-Hours associated with each task, especially as tasks may have a responsible person who belongs to a specific Discipline / Trade.
The Man-Days by Day report is a Decision-Support Mechanism in SPS|PM that allows you to view and analyze the forecasted labor capacity requirements for upcoming work either by team member or Discipline / Trade in order to alert you to any peaks or valleys in labor capacity requirements.
To access the Man-Days by Day report, complete the steps below:
- From the Main Navigation Bar select Reports, then select Man-Days by Day.

- The Man-Days by Day report opens in a new window and automatically displays the report for the team selected under the Team Menu.
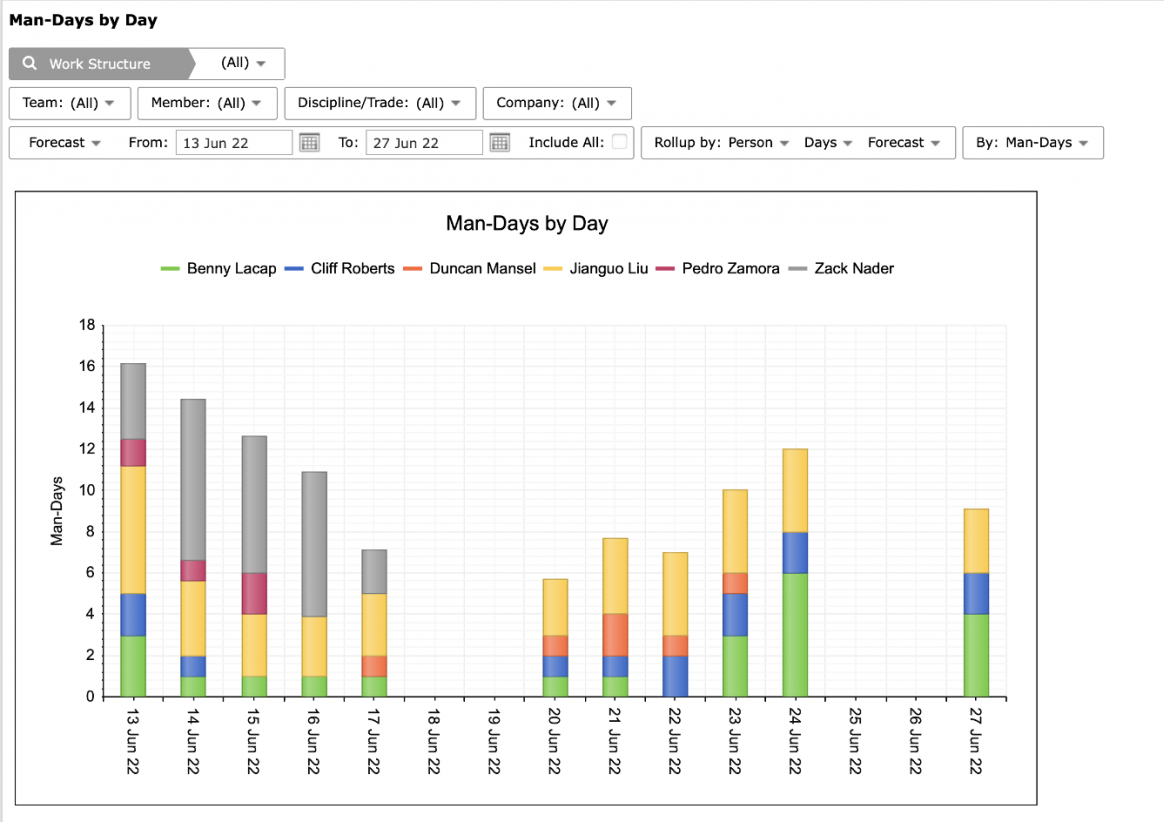
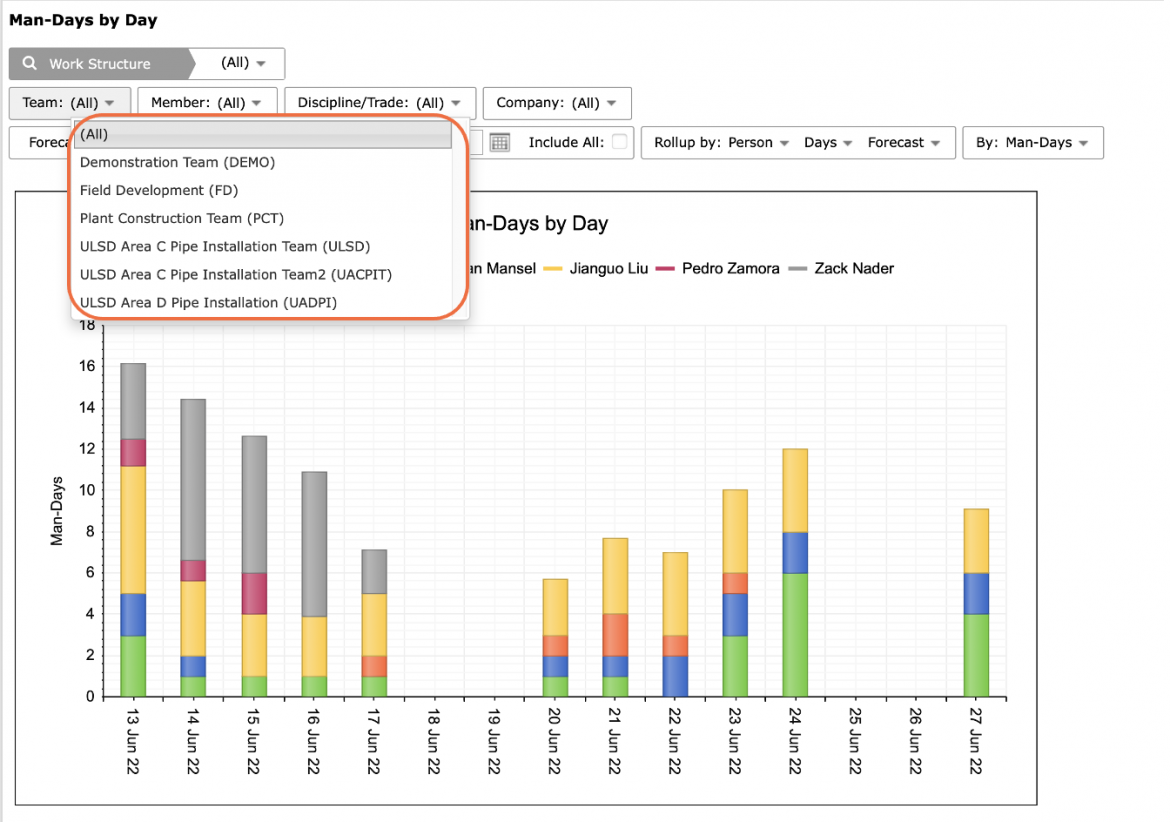
- To view the Man-Days by Day report for another team, select the desired team under the Team drop-down.
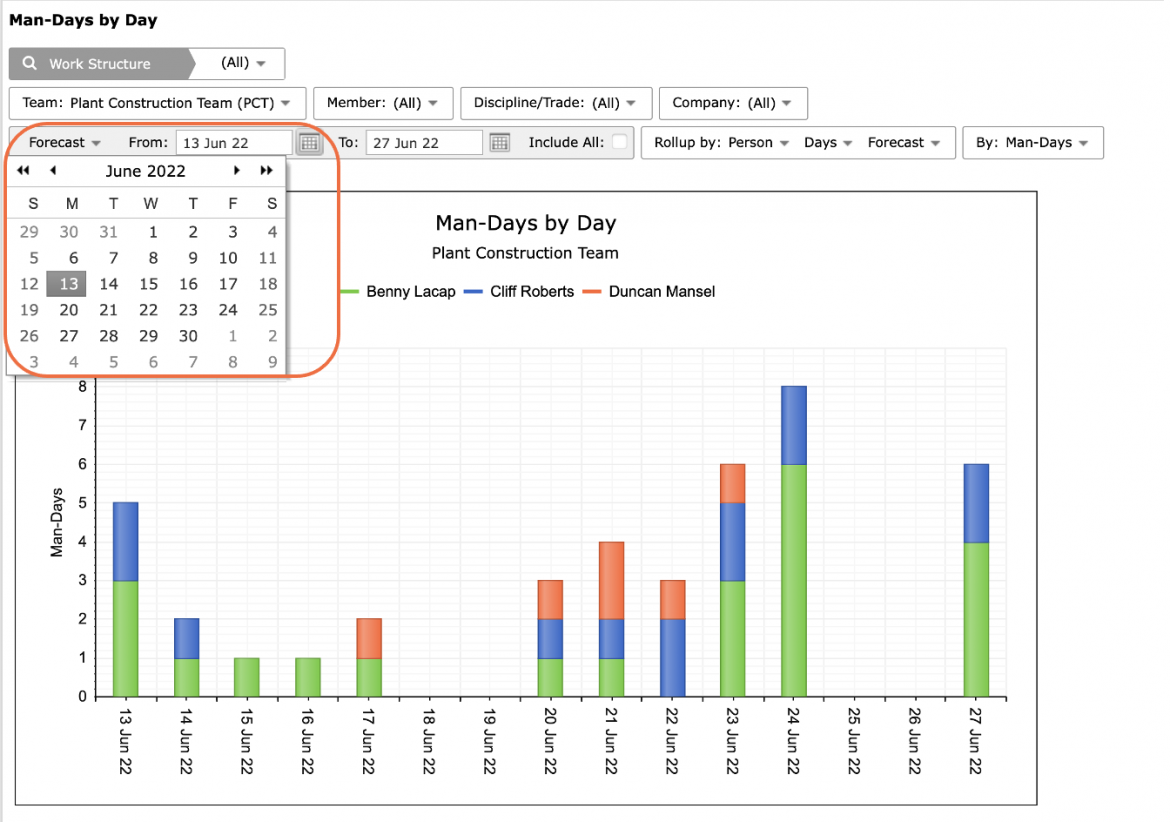
- If a different date range is desired, or no data is visible, adjust the From and To dates, or check to Include All to show all historical data.
The legend elements, each team member’s name, are clickable and toggle to display / hide data.
- Also, use the Pin icon in the top right of the graph to include the Man-Days by Day report in your Dashboard.
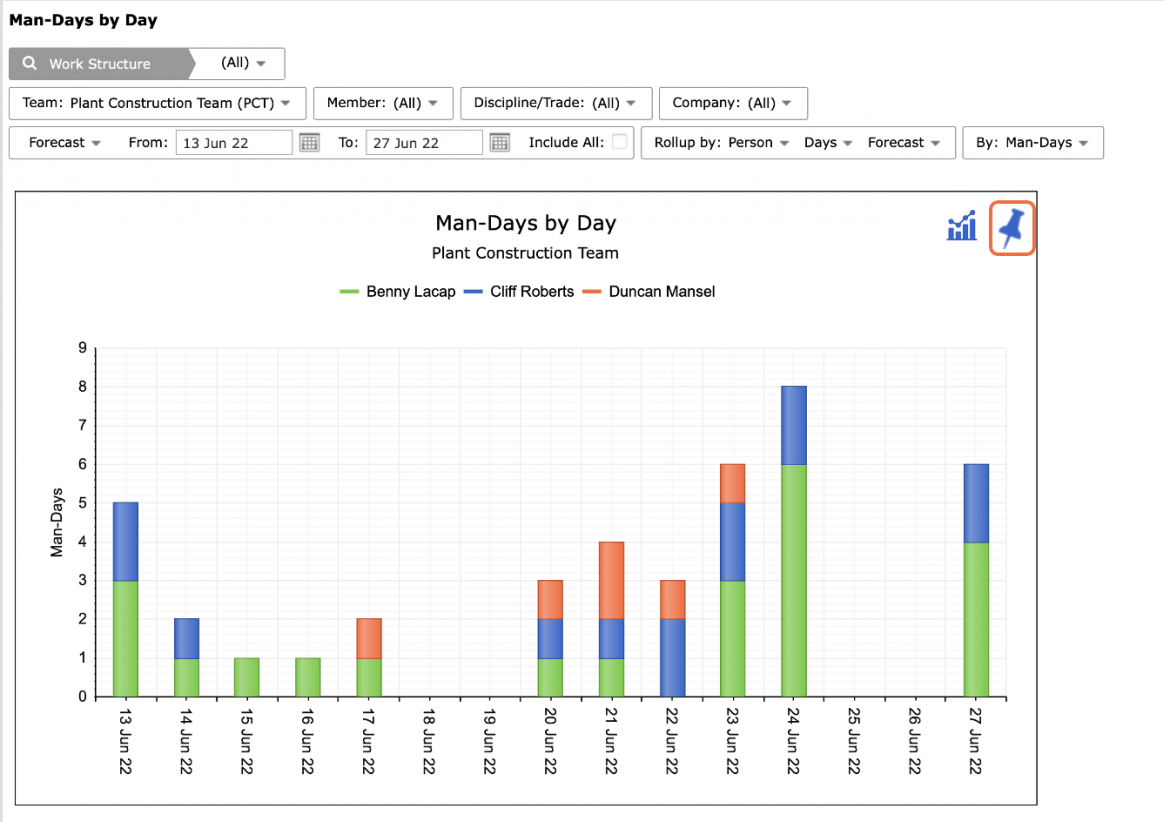
- The Man-Days by Day report uses the Man-Days value that has been entered for each task to compile the total Man-Days required to complete the forecasted work for each day. For example, if a team has 4 one-day tasks with forecast dates of 12 January, and each of those tasks is a full day of work for a 2-man crew (i.e., each task requires 2 Man-Days), then the total Man-Days required for 12 January is 8. The report plots the required Man-Days for each day to allow you to see variation and to determine if the forecast dates of certain tasks should be modified in order to level the labor capacity usage.
- Select Work Structure, Person, Discipline / Trade, and any other attributes, in addition to date range, to filter for the desired data. The dates can either be limited to a certain start date (From) and end date (To) or can include all future tasks for the project team if Include All is checked.
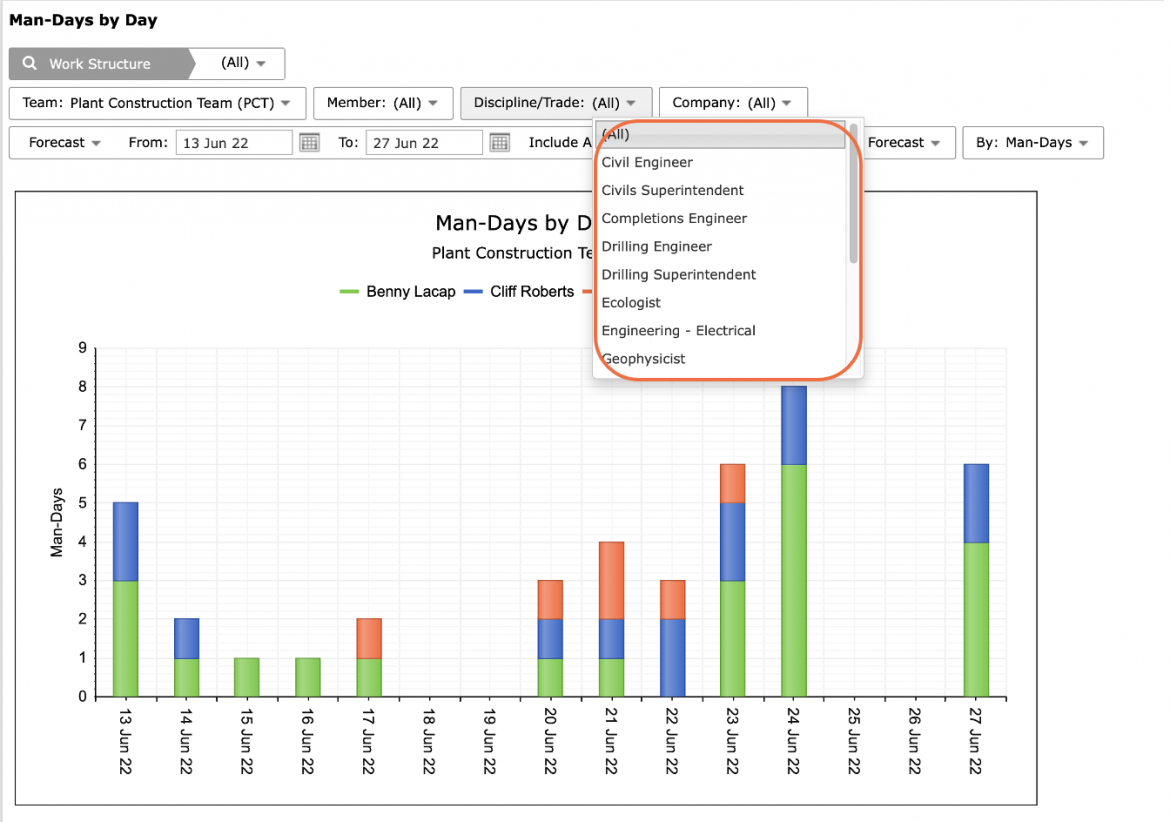
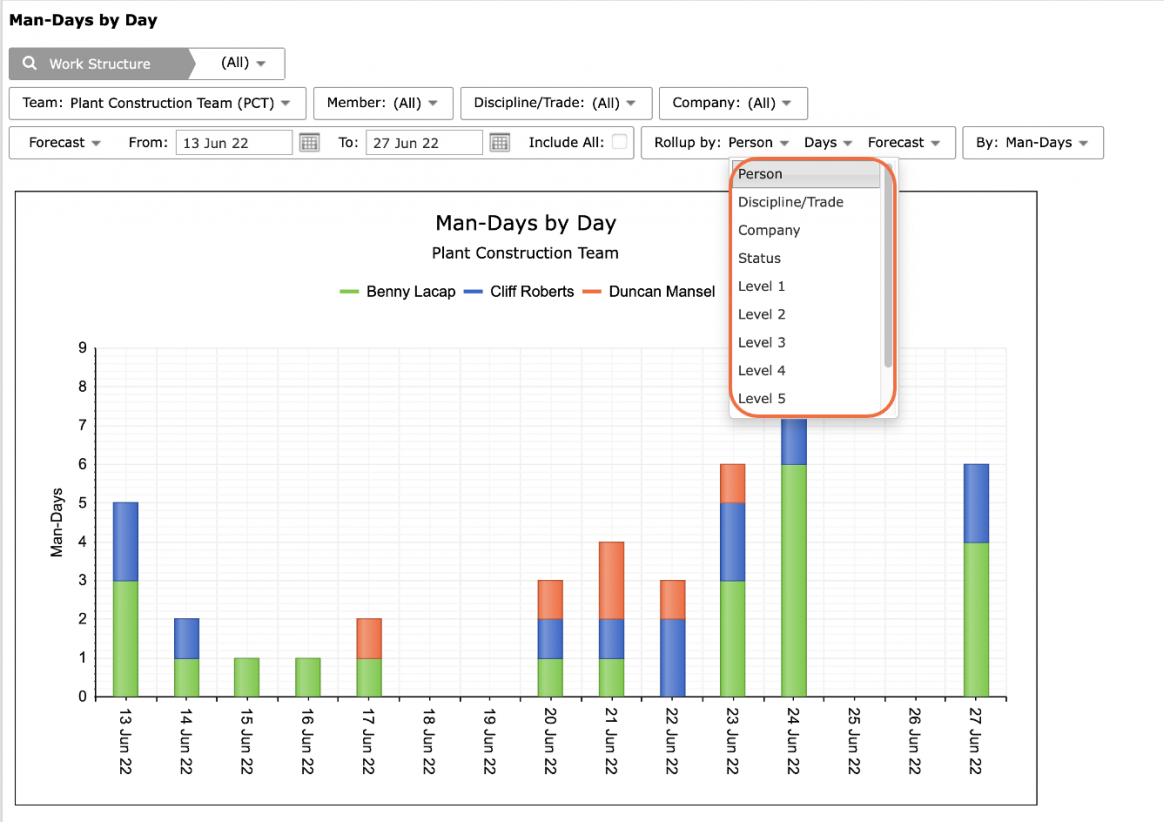
- The Man-Days by Days report can also be rolled up by Discipline / Trade, Company, and Milestone / Task status to allow you to analyze labor capacity requirements for an entire workflow or portions of it.
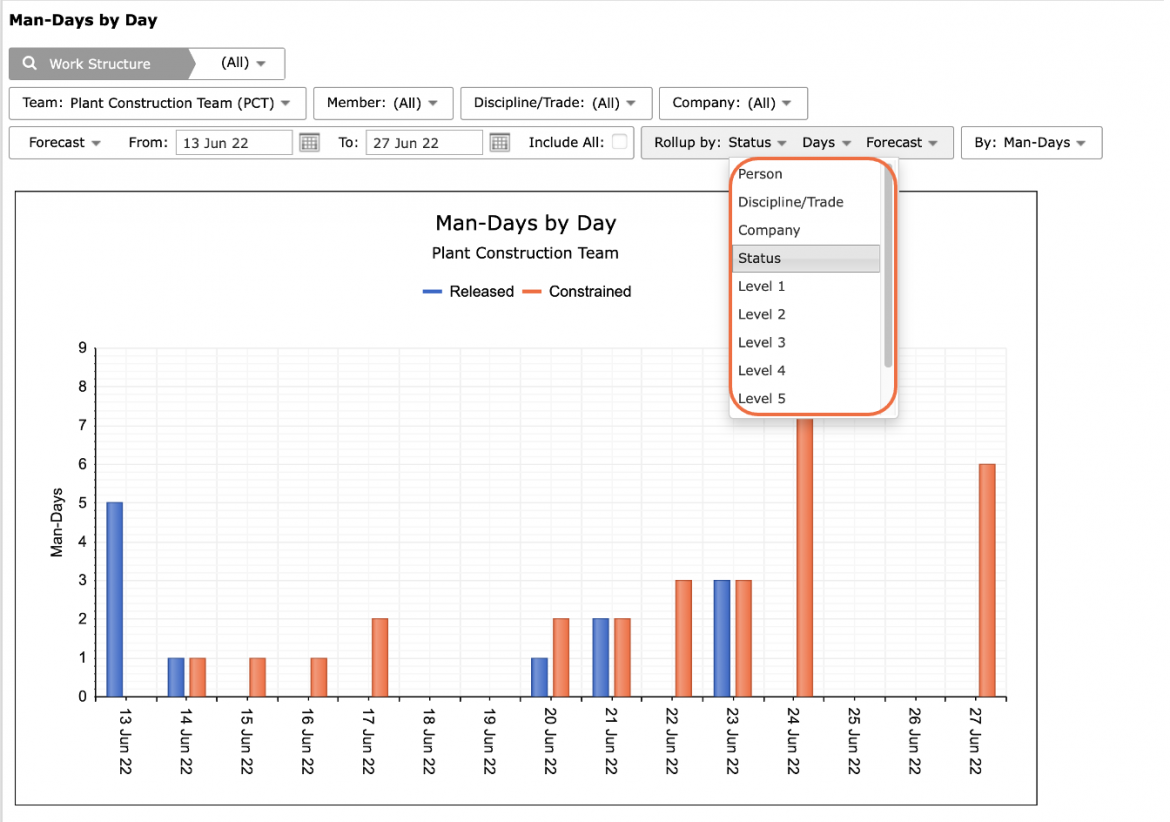
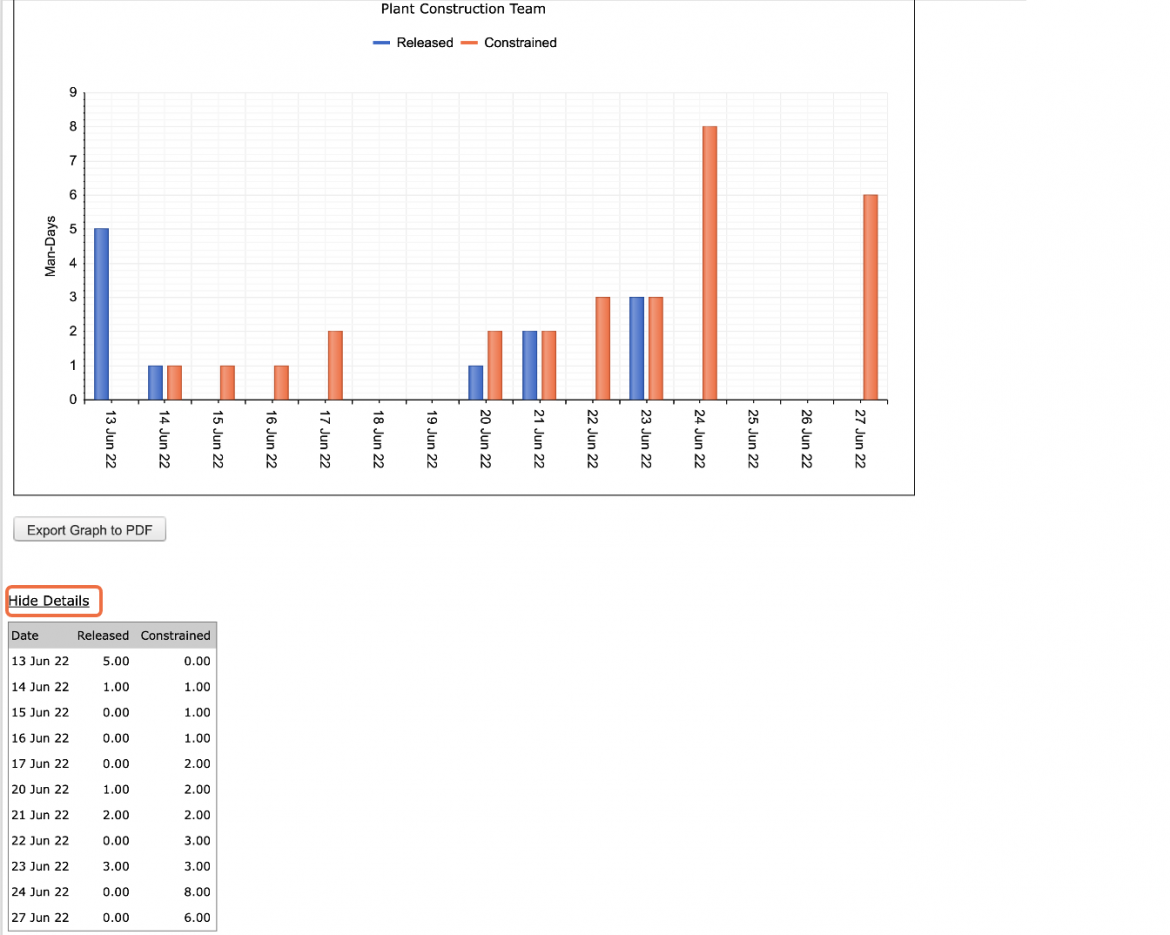
- If “Status” is selected for Rollup by, the Man-Days required for any released task are shown in blue and the Man-Days required for constrained tasks are shown in orange. This is important since the existing labor can only be assigned to work that is not constrained.
- To view the specific Man-Days values, click Show Details beneath the graph.
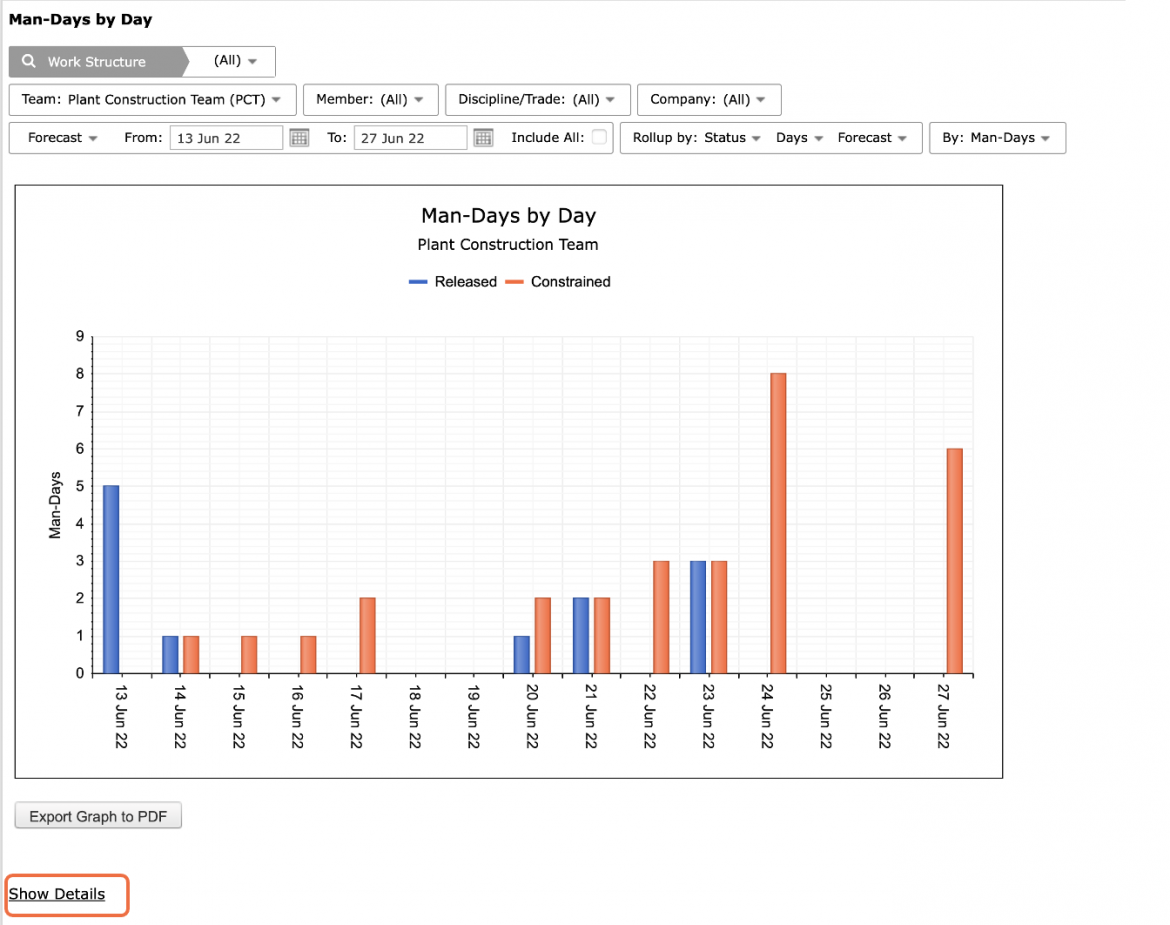
- The Man-Day values display below the graph. To hide the values, click Hide Details.
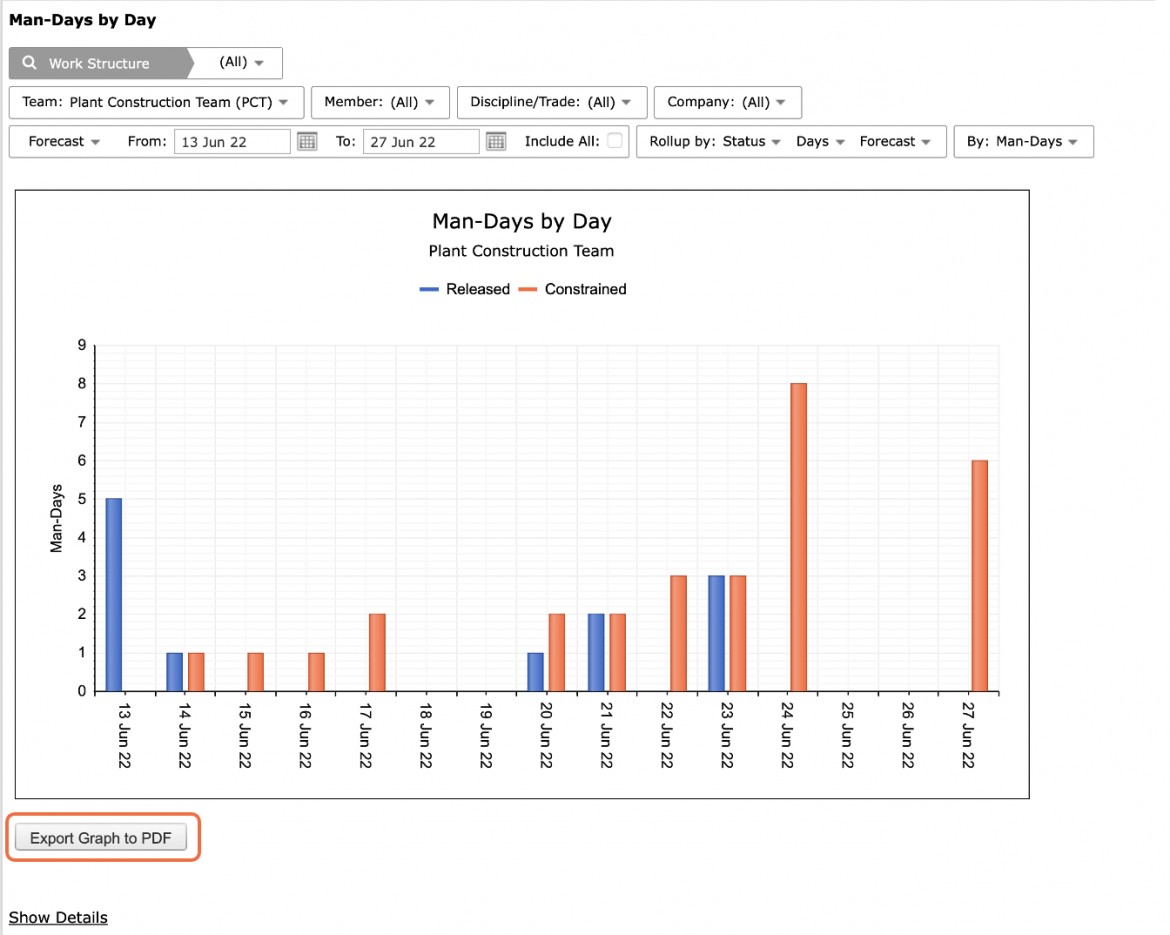
- To export the Man-Days by Day report to a PDF file, click the Export Graph to PDF button and follow the prompts according to the specific browser you are using.
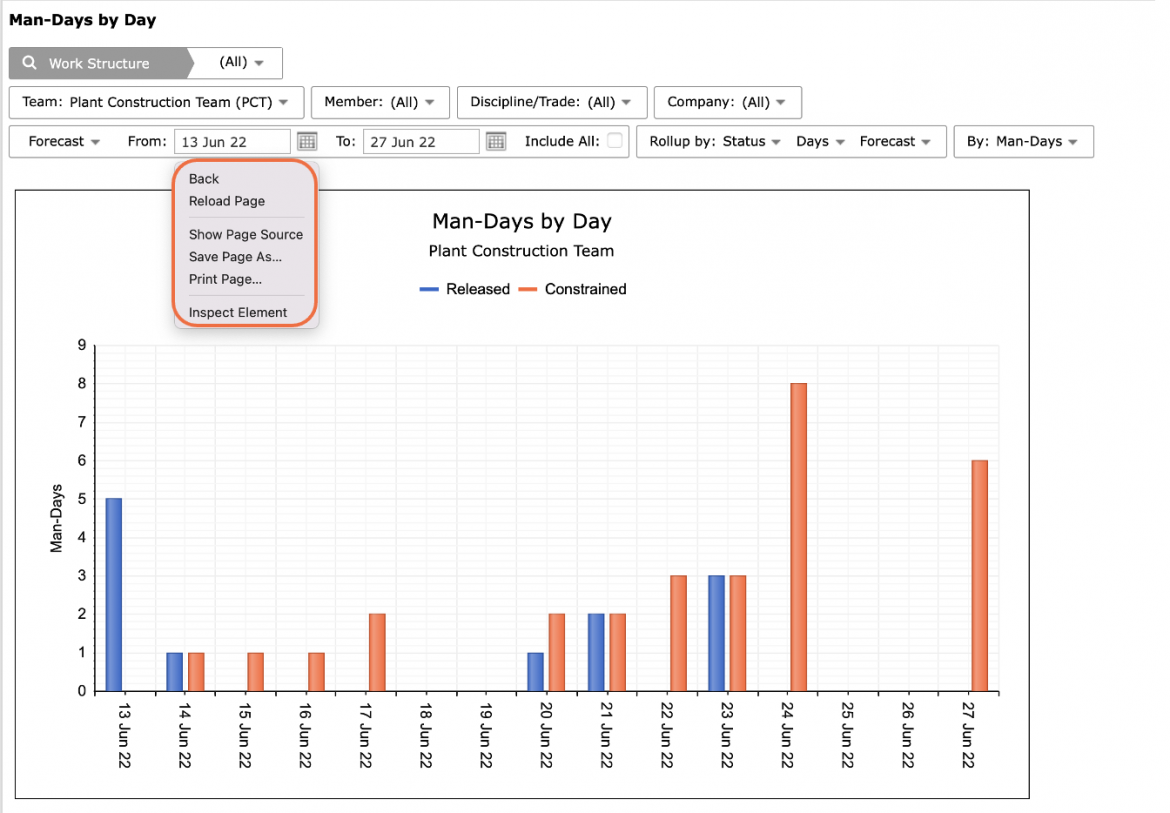
- To print the Man-Days by Days report, options may differ based on your browser. For instance, if you are using Internet Explorer, right-click in the white space outside of the Man-Days by Days report and select Print from the menu or simultaneously press the Ctrl and P keys on your keyboard.
- The Print Dialogue box opens.
- Using the Print Dialogue box, change any desired print settings. Once all relevant printing settings have been modified, click the Print button.
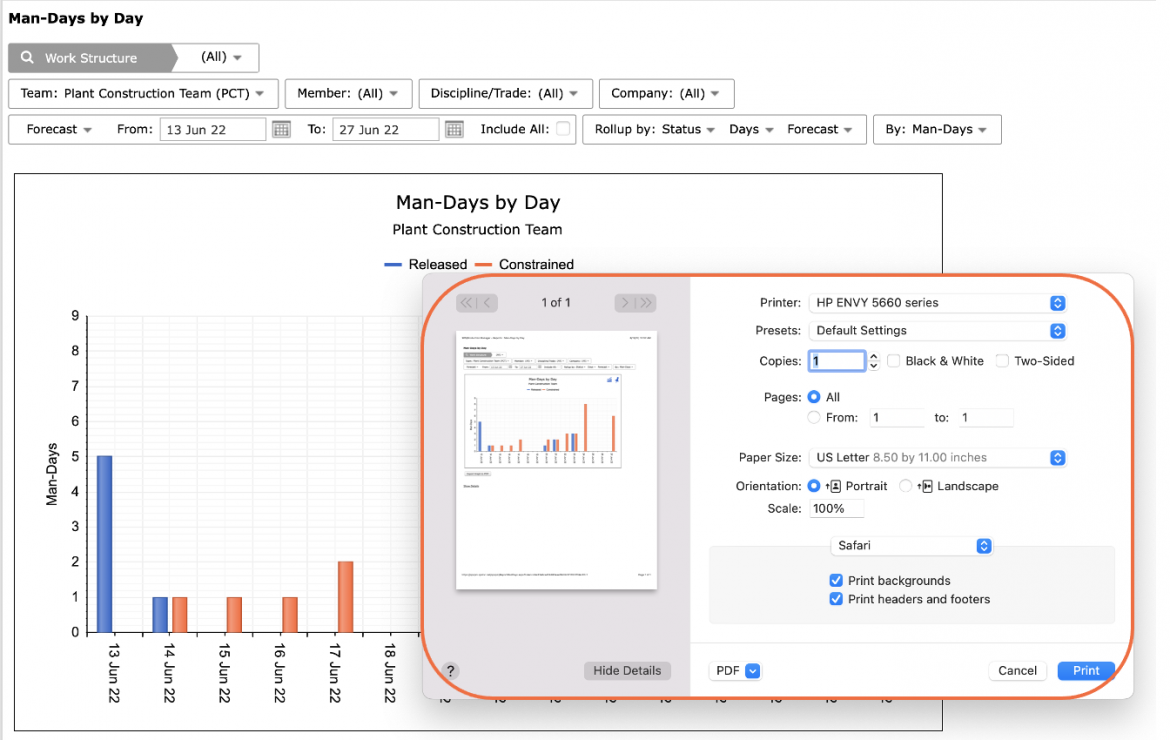
Note: Before printing, it is recommended you confirm the fit to the desired paper size.