
Maintaining a reliable Lookahead is critical as the lead time for materials and additional resources (labor, equipment, and even use of space) is often greater than one day and the implications for improvement of coordination and reaching the overall project goals are significant.
Each project team’s ability to reliably forecast its work is critical in order to optimize the use of capacity (people, equipment and space) and effectively integrate with other teams’ work, including coordinating the supply of materials. SPS|PM uses Lookahead Reliability (PAT) to measure a team’s ability to forecast work through a measurement called Percentage of Anticipated Tasks (PAT).
PAT is calculated by comparing each Production Plan’s Planning Horizon with each committed task’s forecast start date, planned as of 5 or 10 days prior (PAT 5 and PAT 10). A team’s Production Plan is considered to have 100% Lookahead Reliability (PAT X) if all tasks on a given Production Plan had the forecast start date x days prior, matching the Planning Horizon. For example, if a team puts a task on the Production Plan for 14 June and 5 days prior it had a forecast date of 14 June, this task would be considered reliably identified in terms of PAT 5. The same logic applies for PAT 10.
The target minimum PAT values are 50% and 35% for PAT 5 and PAT 10 respectively. Since the ability of a team to look ahead decreases with longer Lookahead horizons, it is expected that PAT 10 targets and actual performance be lower than those for PAT 5.
If PAT values are trending up, the project team should determine what it is doing well that is allowing it to improve PAT and how the values can be sustained. If average target Lookahead reliability levels are not achieved, this indicates the need to develop more robust Production Schedules. Additionally, if PAT values are trending down, the team should determine what is causing it to become less reliable. Examine Root Cause Analysis to validate what the team is perceiving. If the team has a high commitment reliability, but low Lookahead Reliability (PAT), the team should determine what is keeping it from getting the work ready to be performed according to the Lookahead.
To access Lookahead Reliability (PAT), complete the steps below:
- From the Main Navigation Bar select Analytics, then select Lookahead Reliability (PAT).

- Lookahead Reliability (PAT) opens in a new window and automatically displays the Analytic for the team selected under the Team Menu with the default date range of two weeks from the current date.
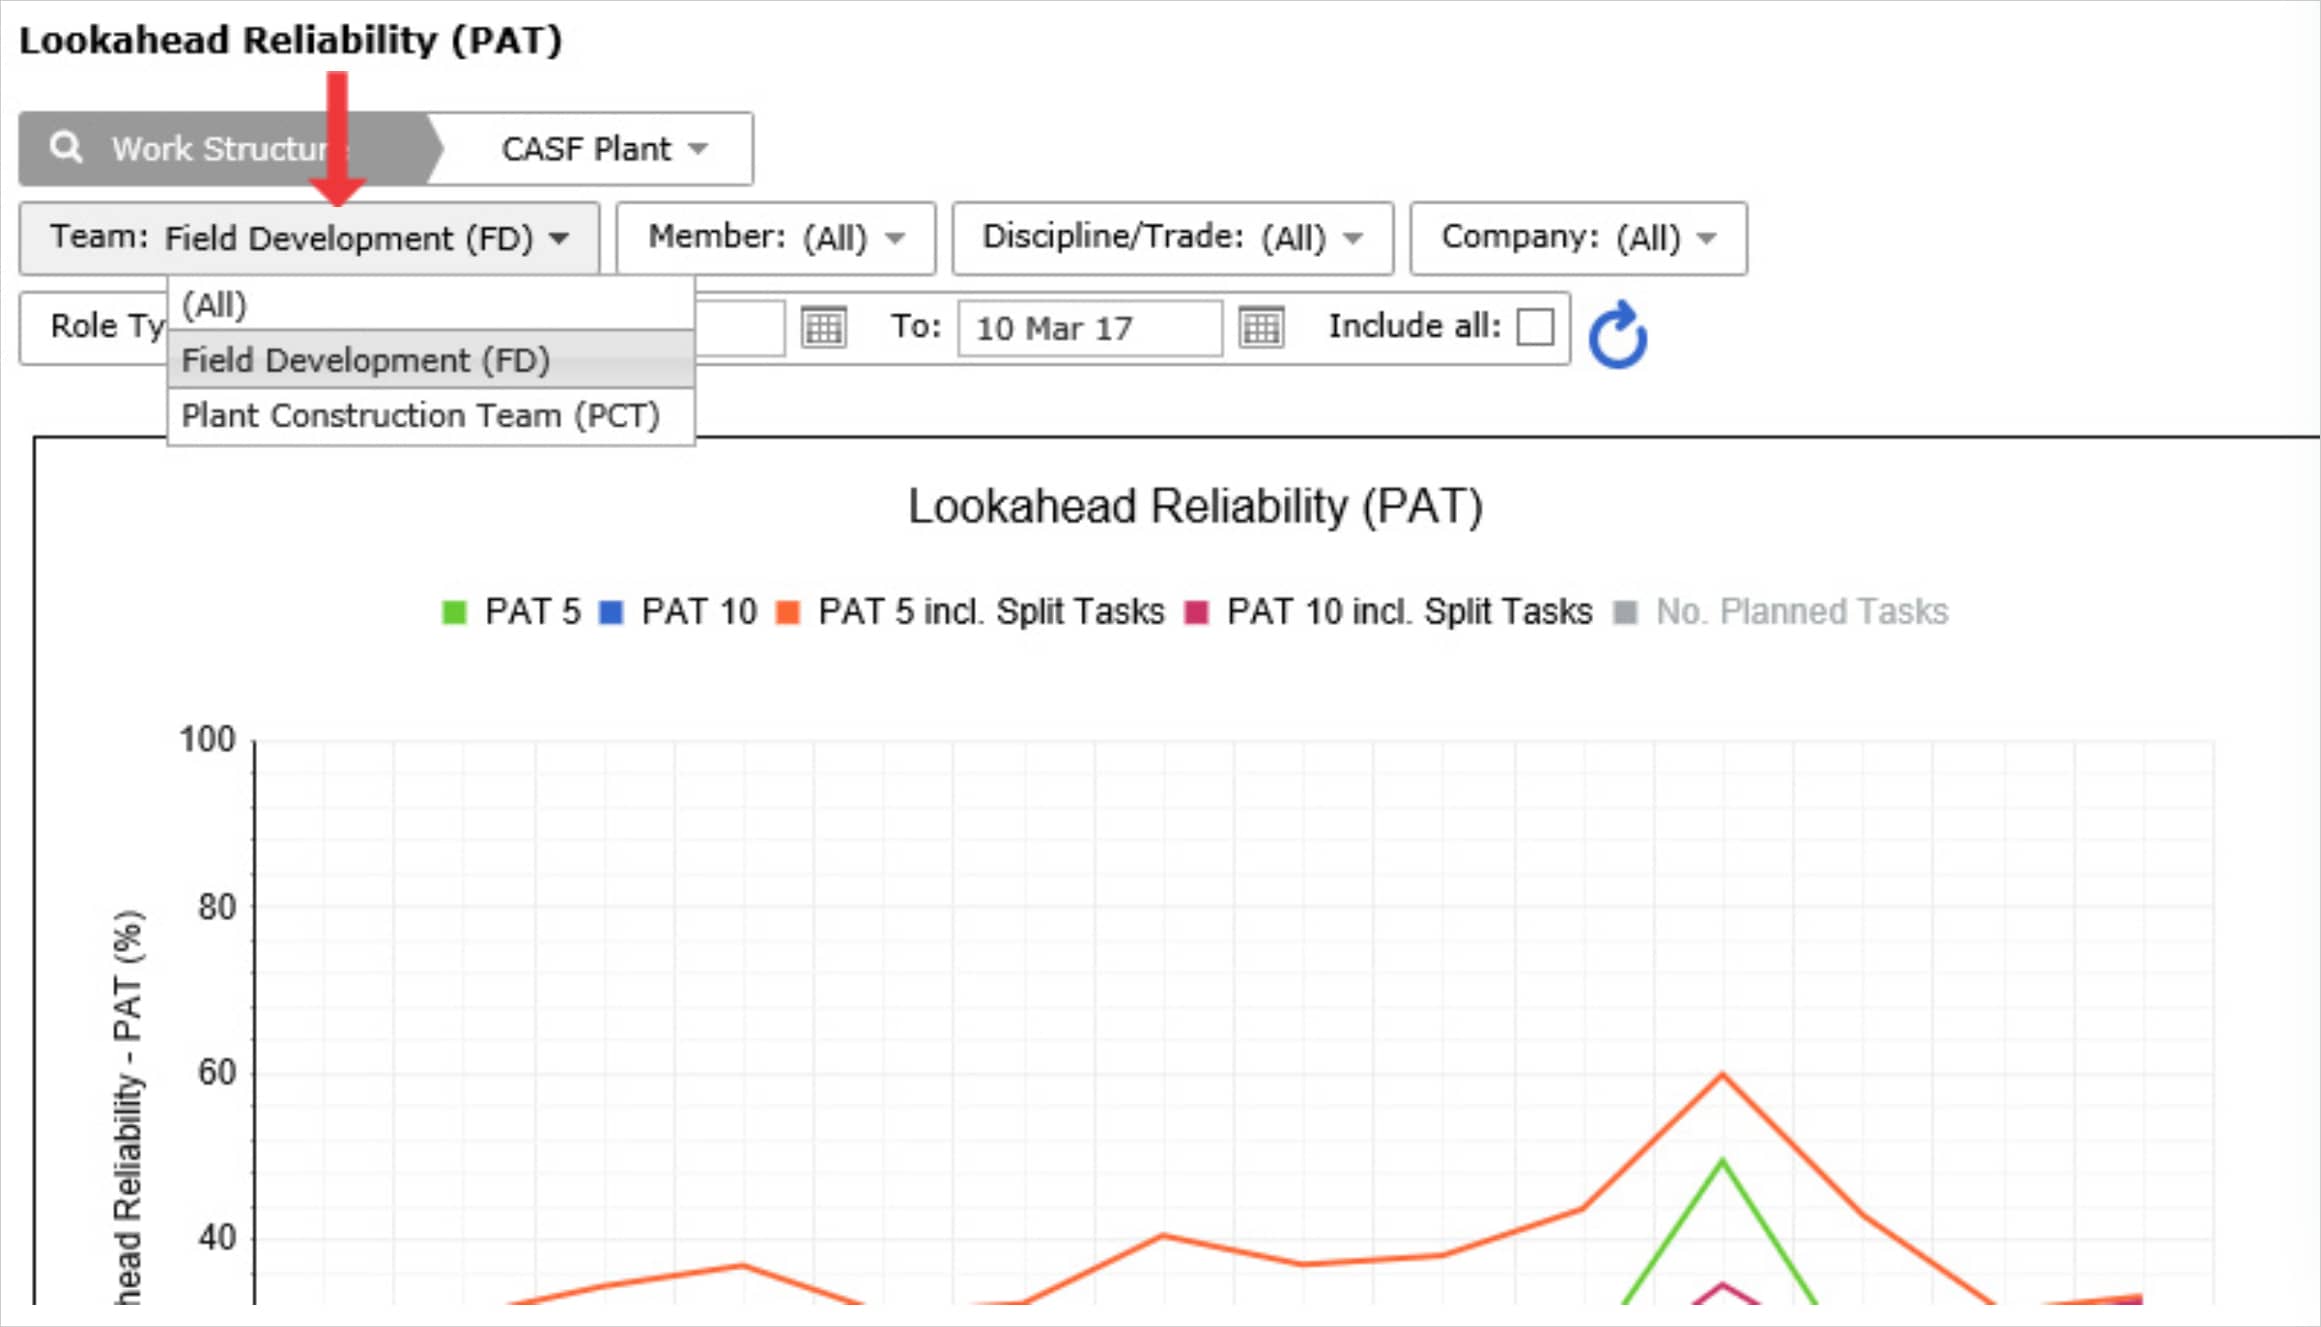
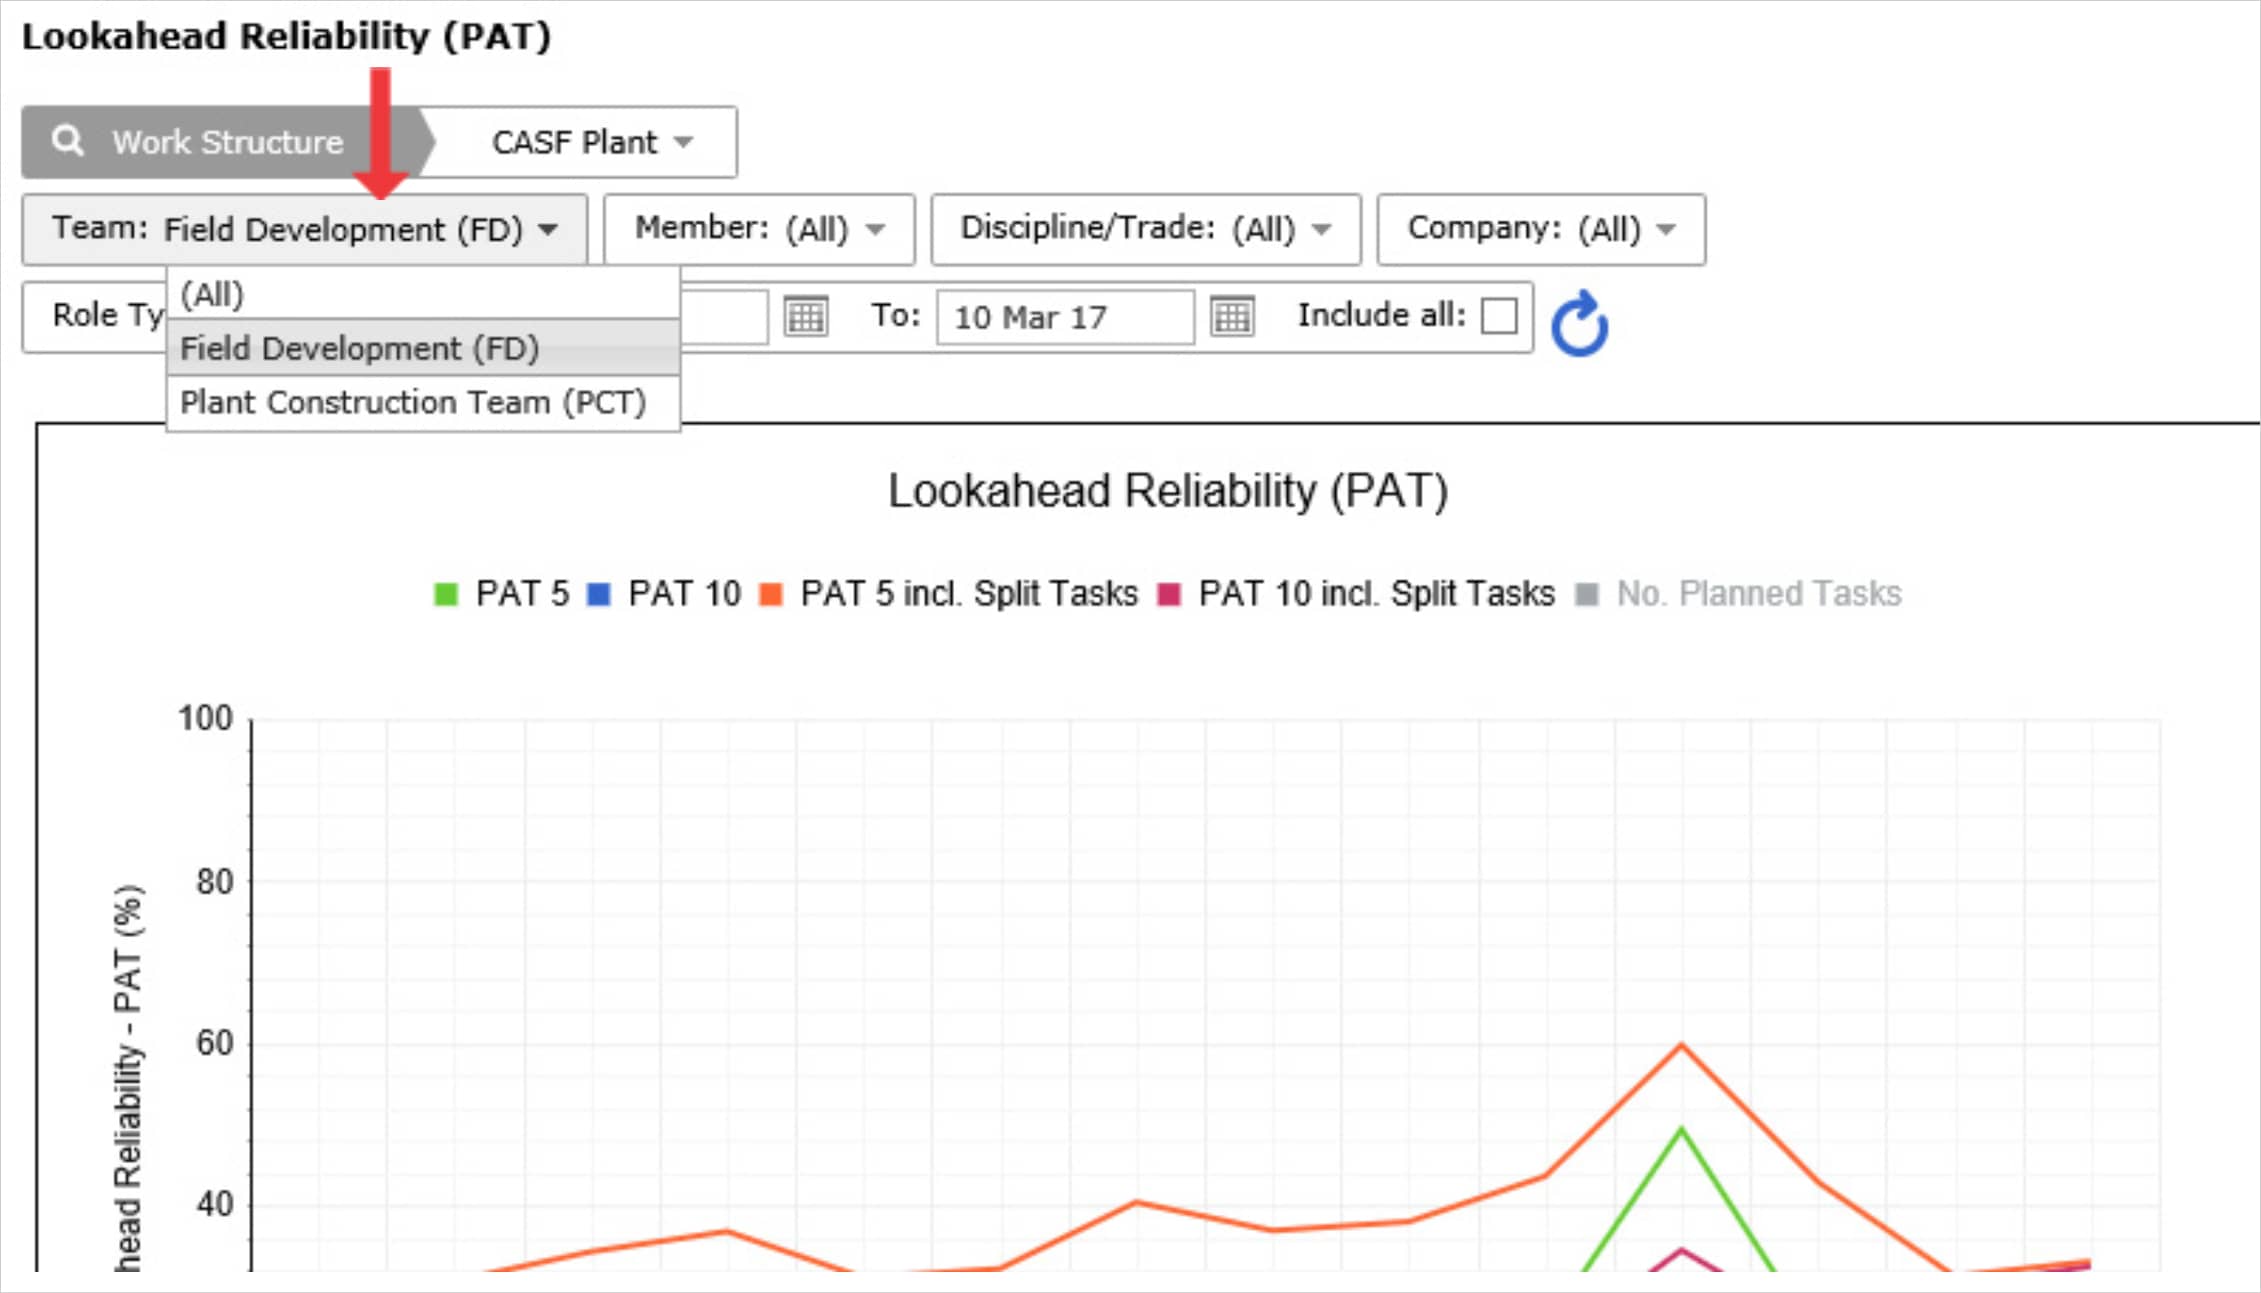
- To view Lookahead Reliability (PAT) for another team, select the desired team under the Team drop-down.
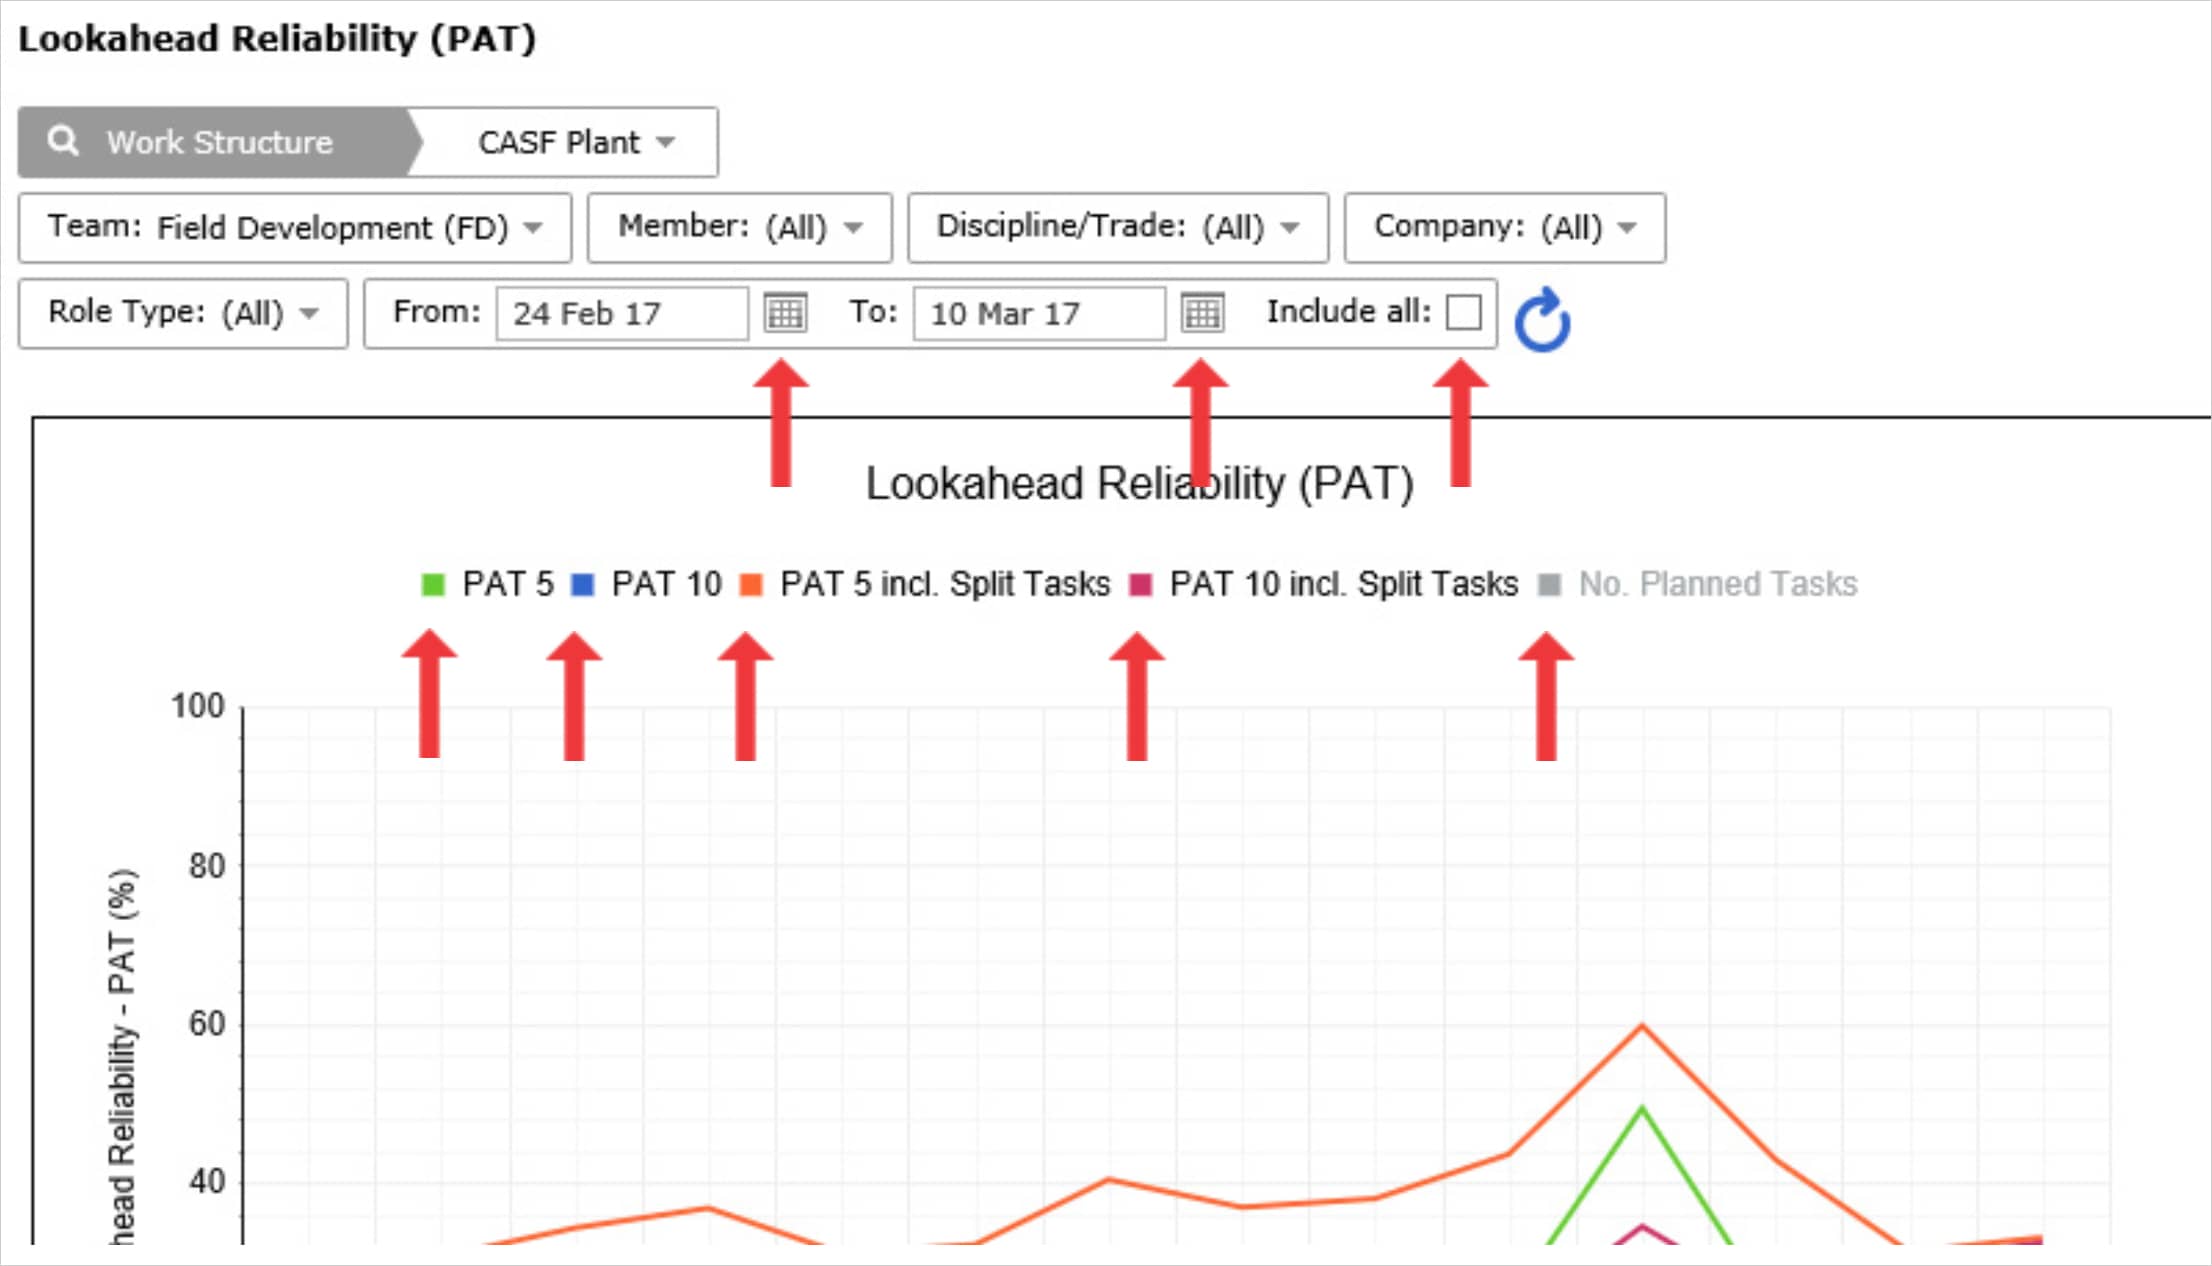
- If a different date range is desired, or no data is visible, adjust the From and To dates, or check Include All to show all historical data.All legend elements, PAT 5, PAT 10, PAT 5 incl. Split Tasks, PAT 10 incl. Split Tasks and No. Planned Tasks, are clickable and toggle to display / hide data.
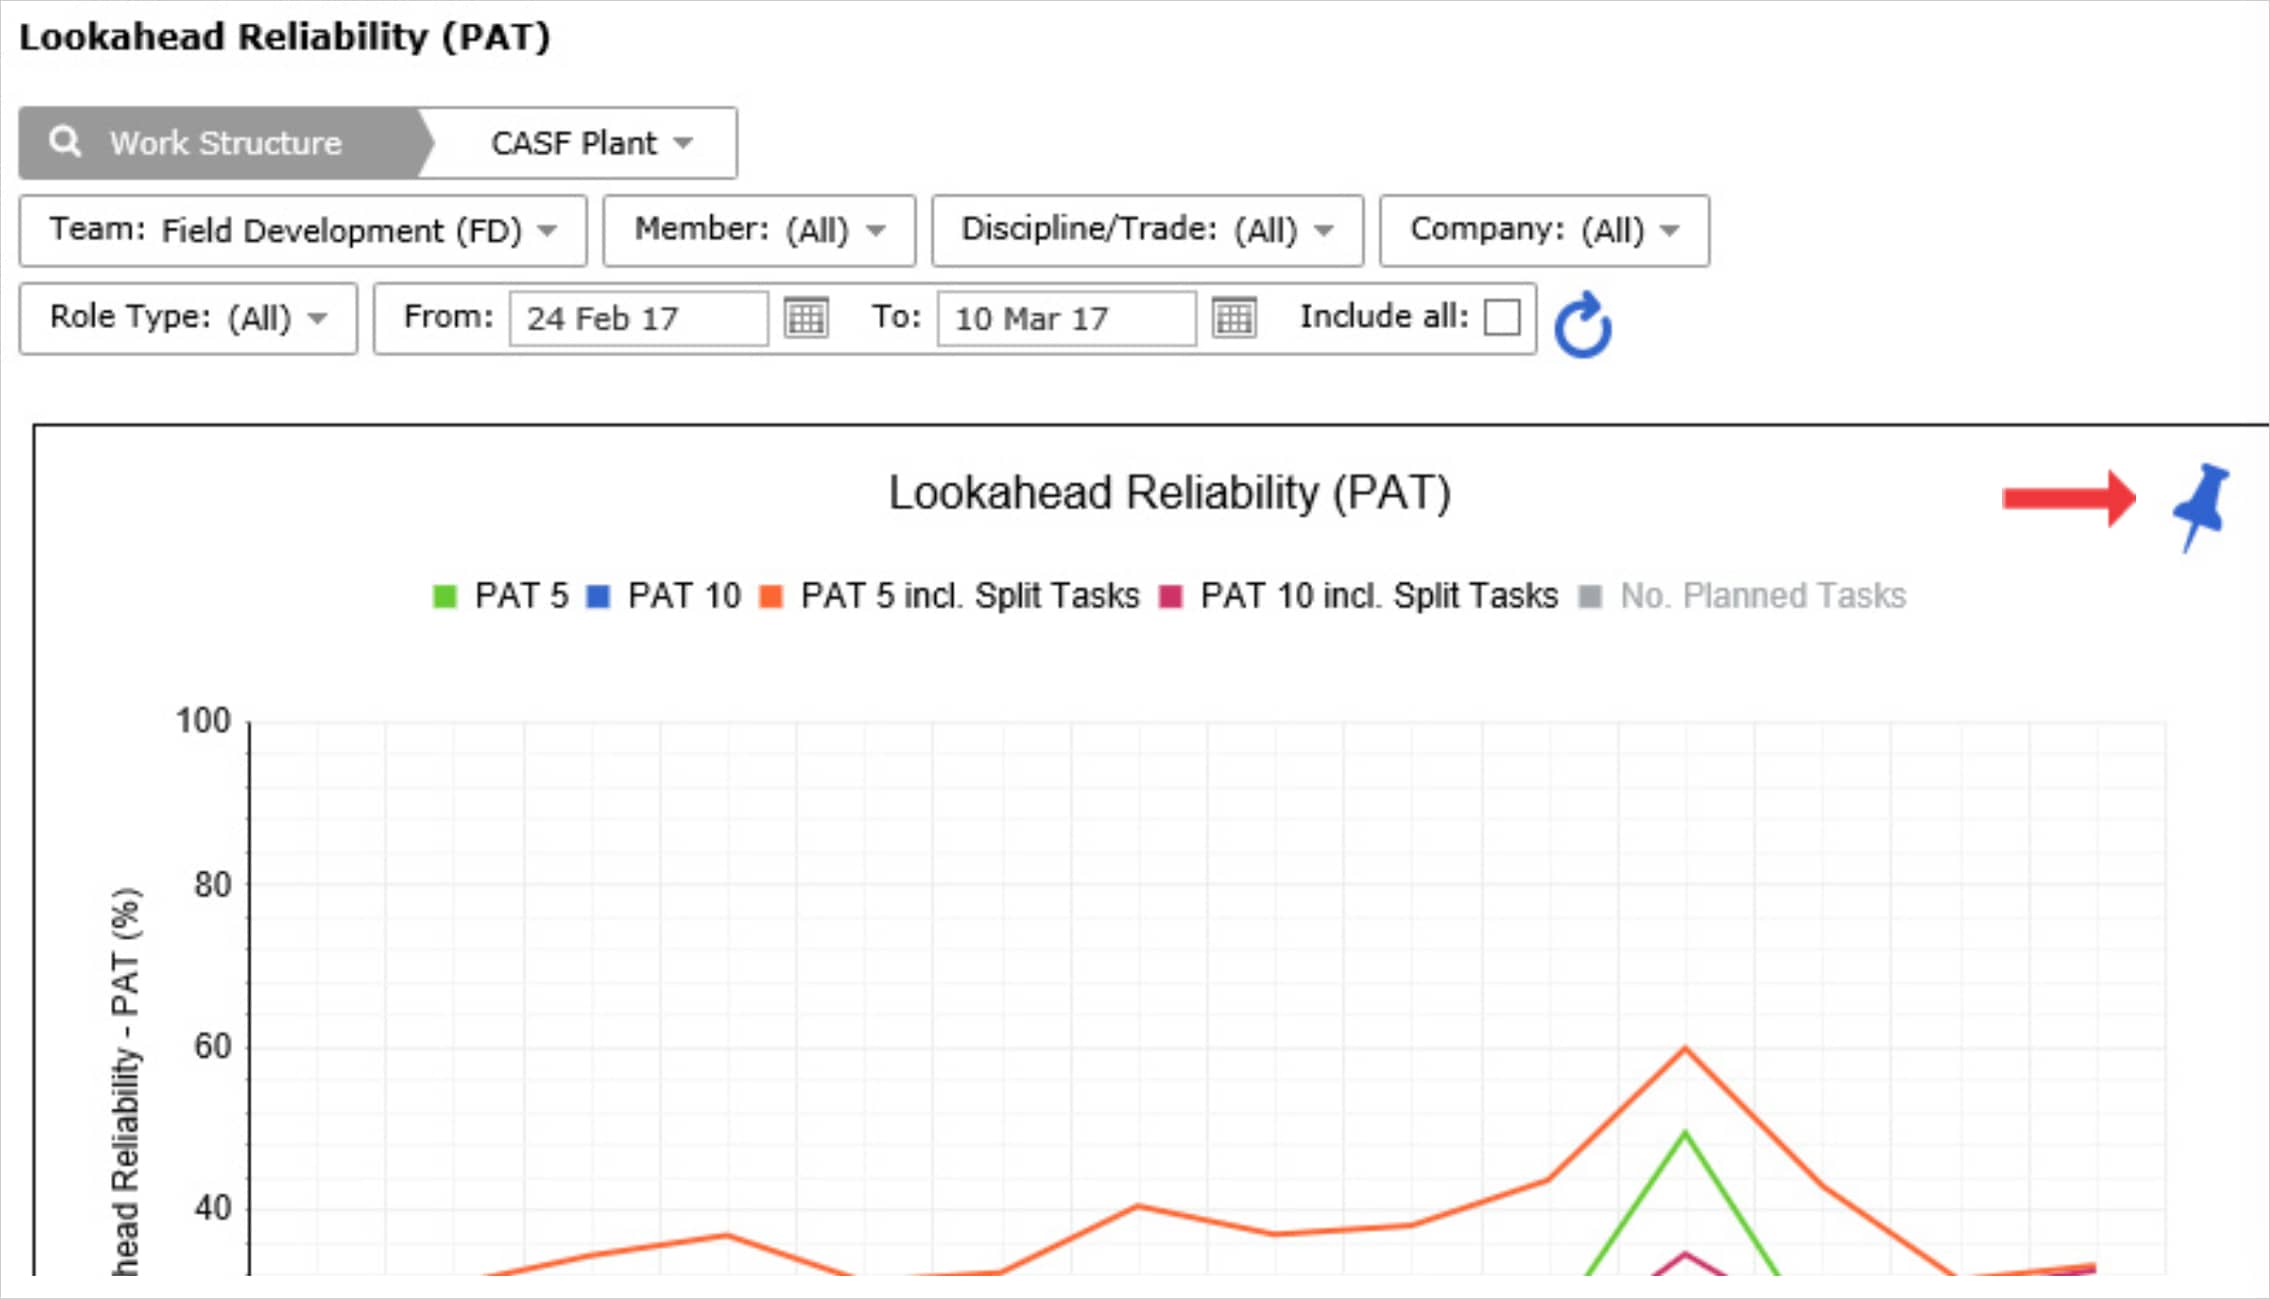
- Also use the Pin icon in the top right of the graph to include Lookahead Reliability (PAT) in your Dashboard.
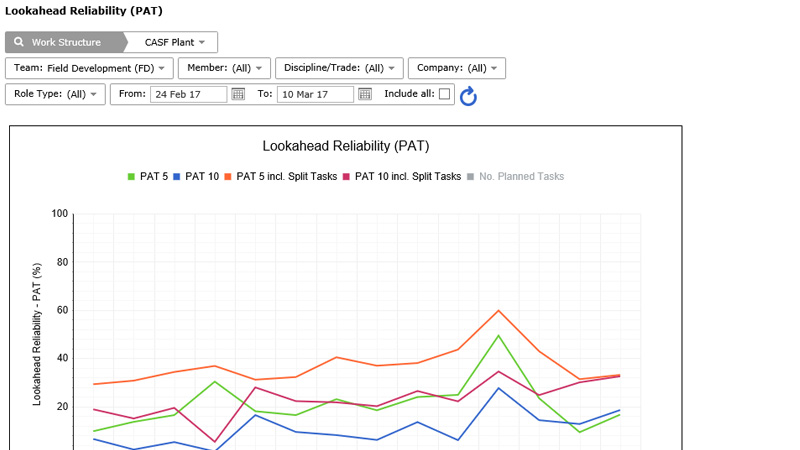
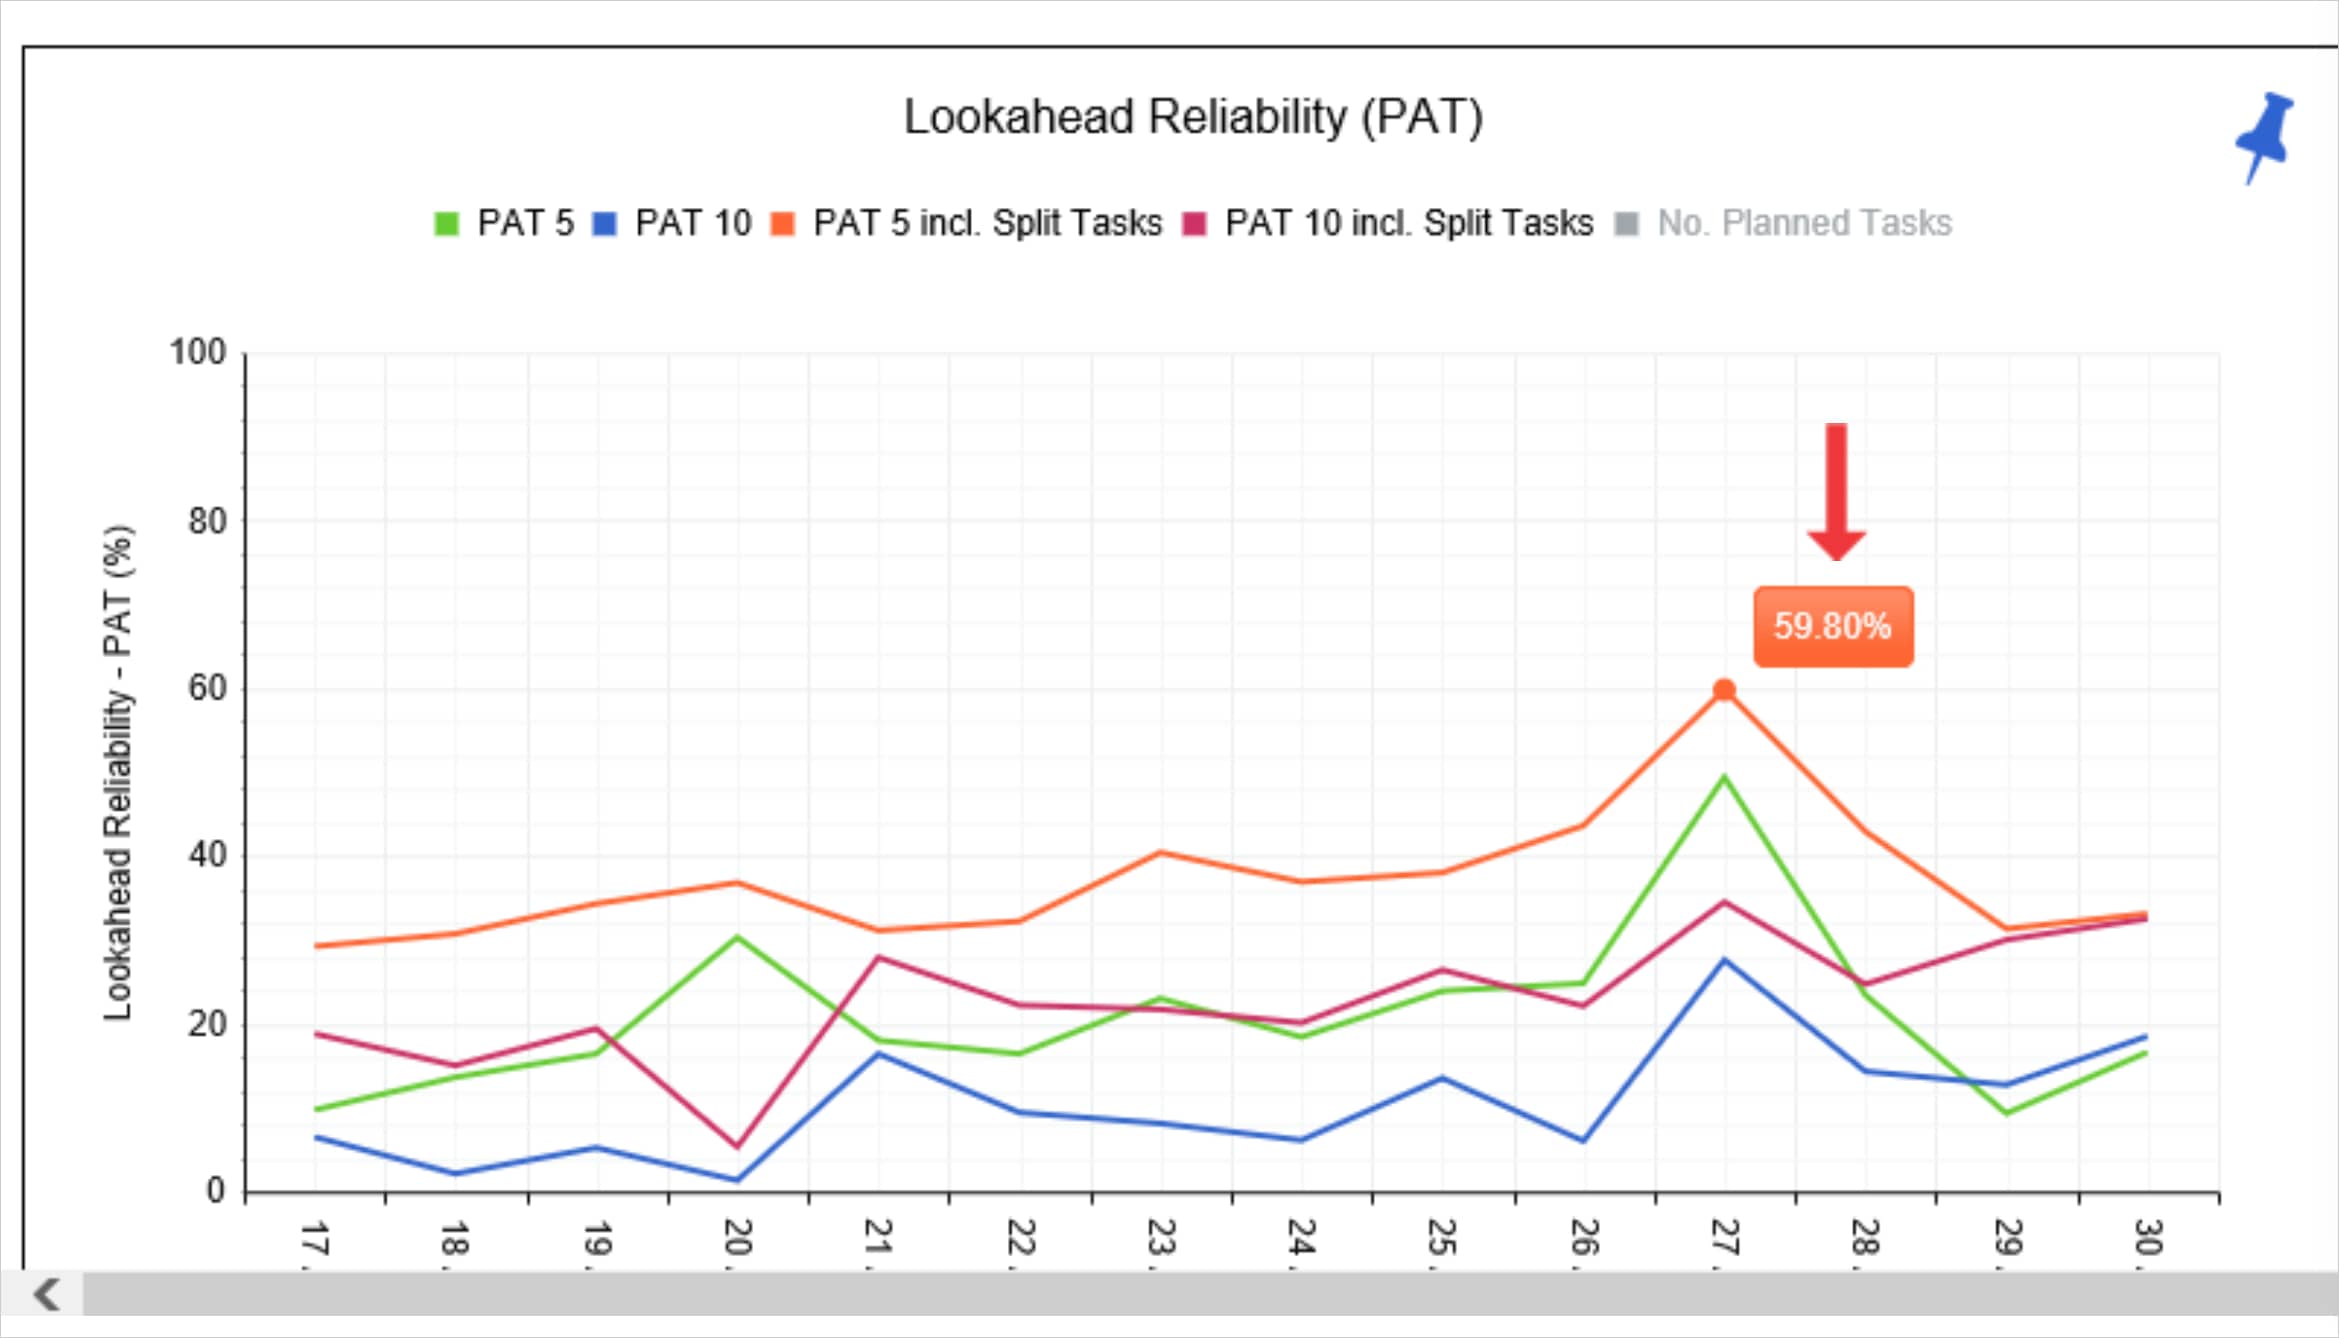
- For the selected team(s) Lookahead Reliability (PAT) displays line graphs for PAT 5 (green), PAT 10 (blue), PAT 5 with Split Tasks (orange), and PAT 10 with Split Tasks (red). Each data point on the graph represents the percentage of anticipated tasks for an individual Production Plan.PAT 5 incl. Split Tasks and PAT 10 incl. Split Tasks are calculated to include any tasks that were split to be committed on Production Plans. The PAT X with Split Tasks performance indicator considers a split task to have been reliably identified if the Production Plan’s planning horizon falls within the forecast dates of its parent task (original task before it was split) X days ago. The delta between PAT 5 and PAT 5 with Split Tasks represents the extent to which the team’s Production Plans rely on split tasks rather than tasks, with durations that are equal to or smaller than the Planning Horizon.
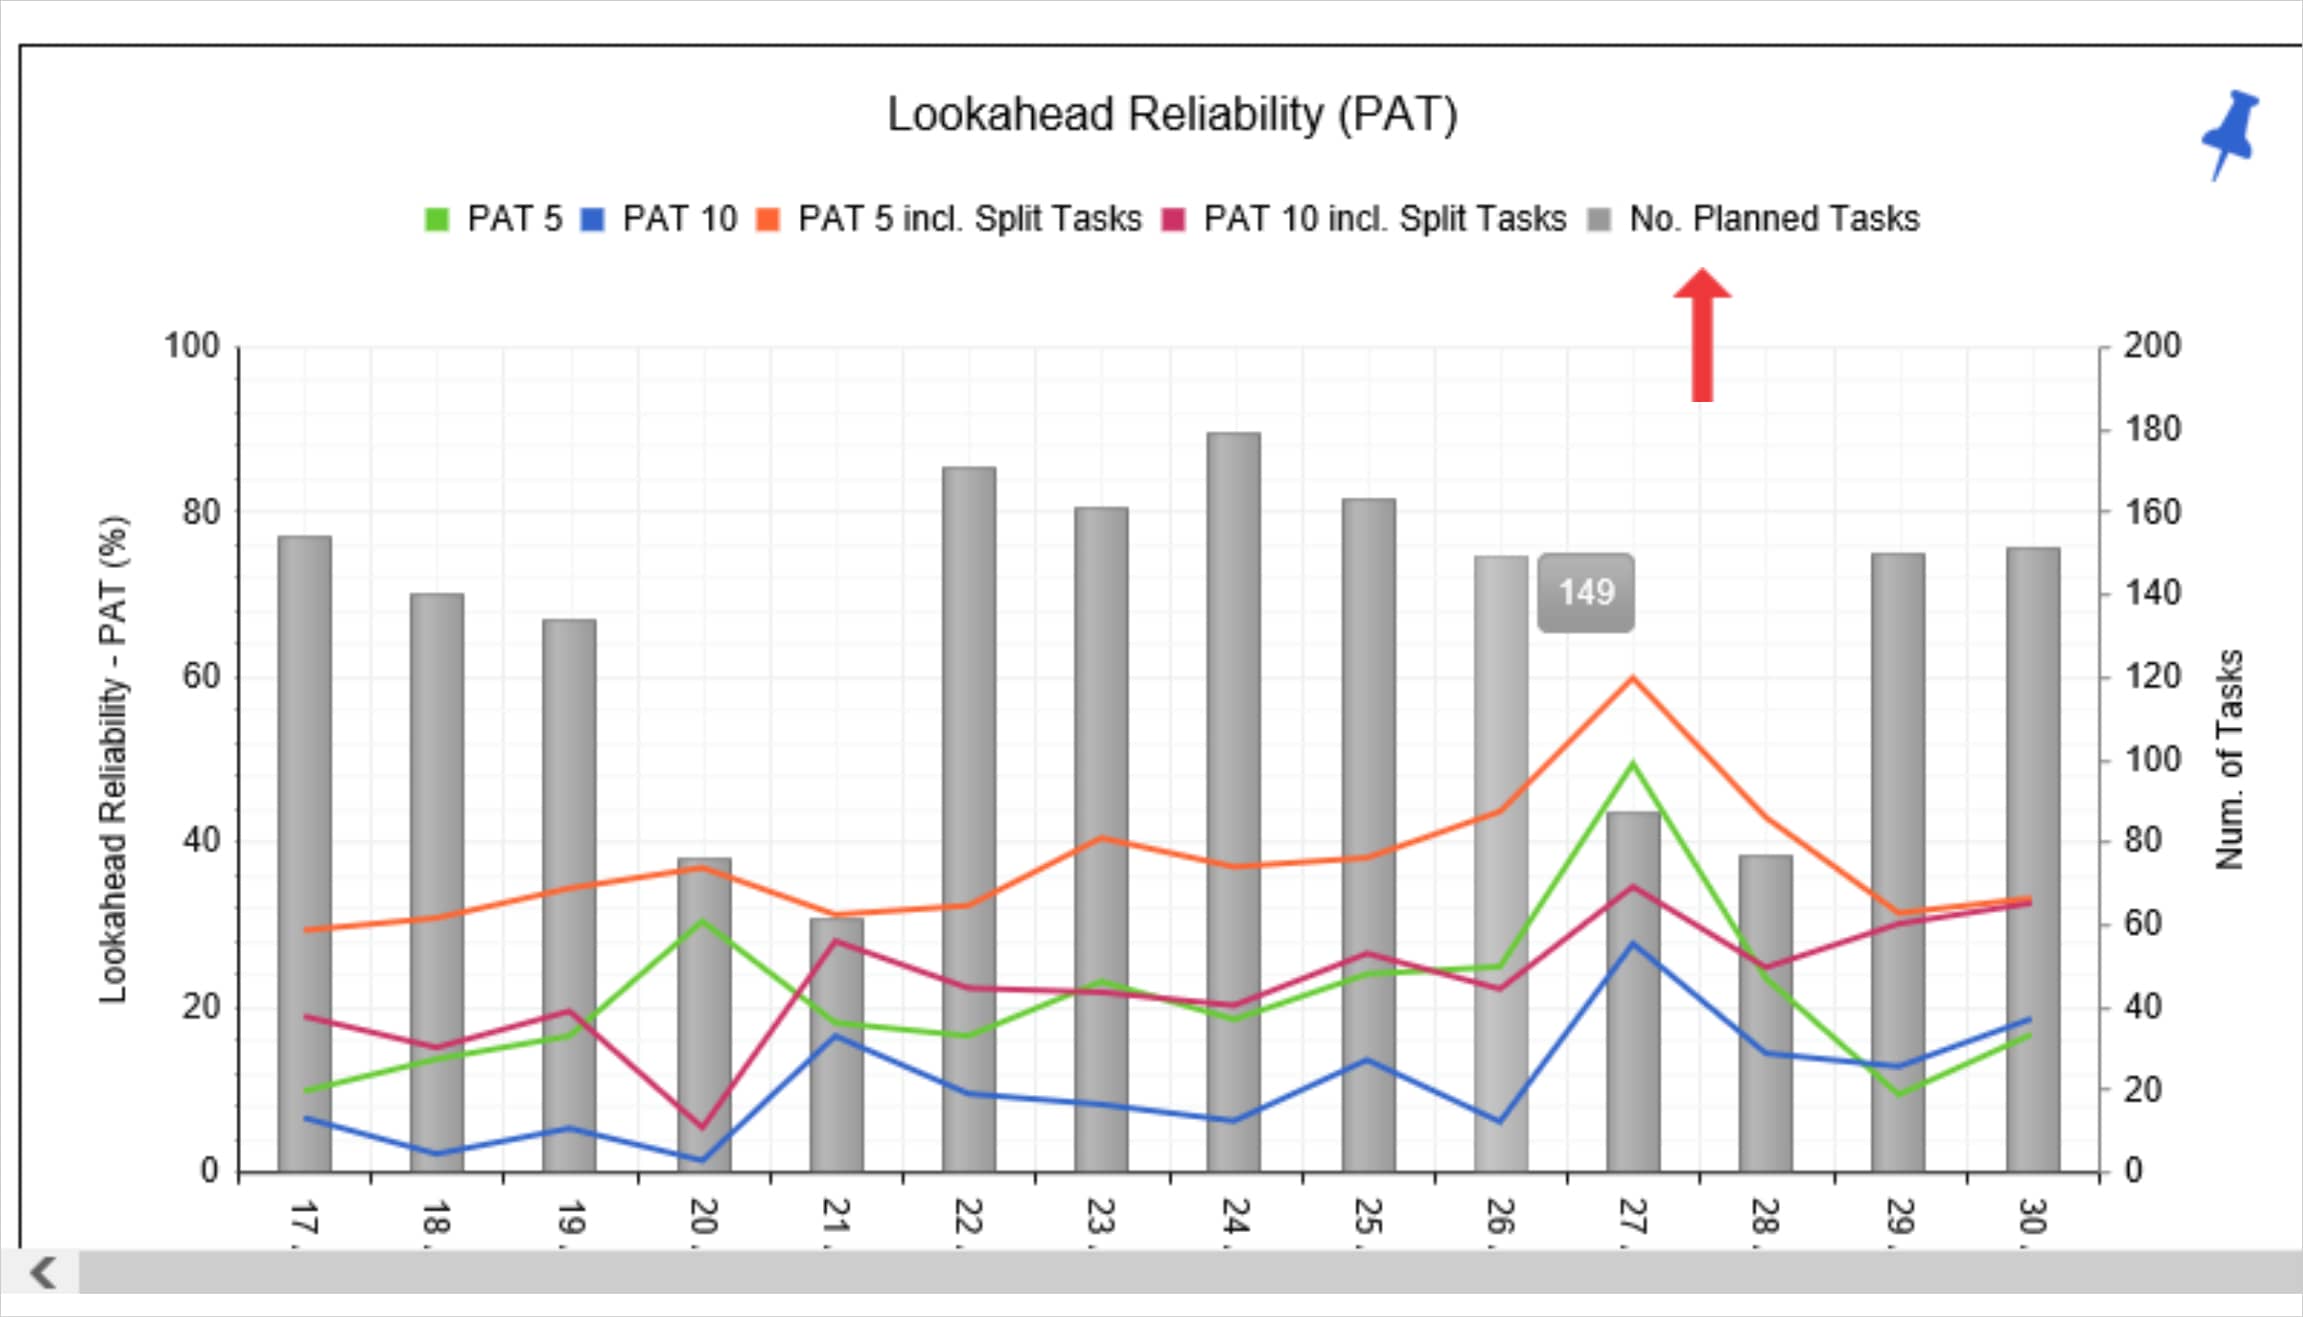
- To view the number of Planned Tasks for each Production Plan click: No. Planned Tasks.
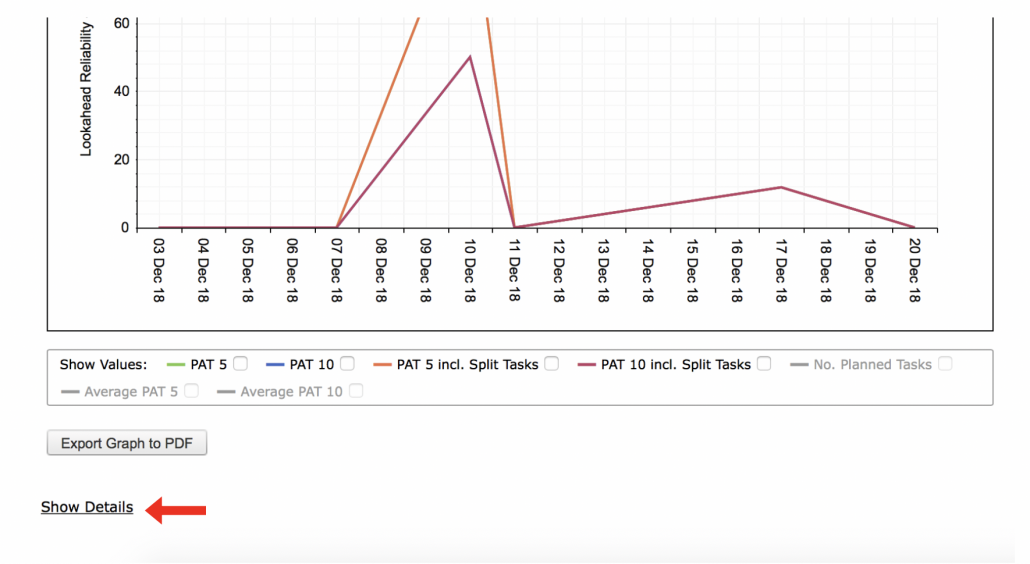
- To view the data behind the Lookahead Reliability (PAT) calculation for each Production Plan click: Show Details, beneath the graph. To hide the data click: Hide Details.
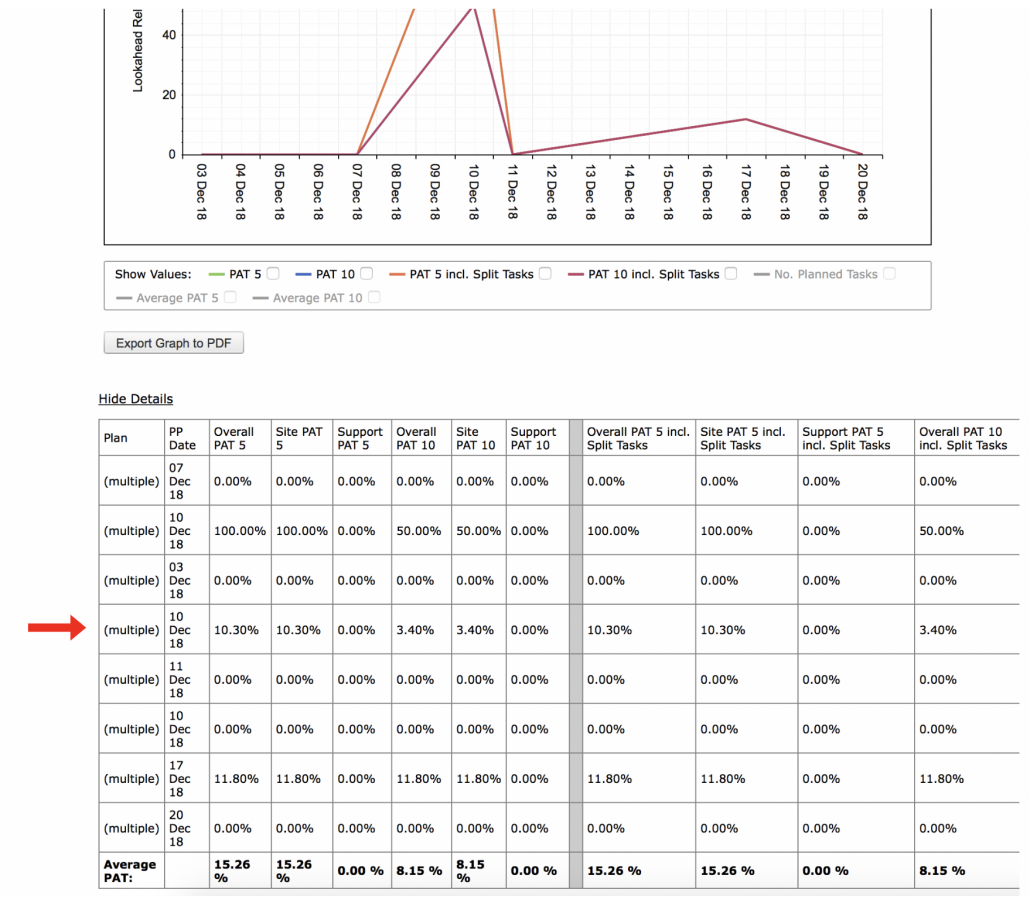
- For each individual Production Plan, the data table lists the Plan ID (Multiple if more than one team is selected), the Plan Date, PAT 5 (Overall, Site and Support) PAT 10 (Overall, Site and Support), PAT 5 with Split Tasks (Overall, Site and Support) and PAT 10 with Split Tasks (Overall, Site and Support). Average values for each of these are shown at the bottom of the table.
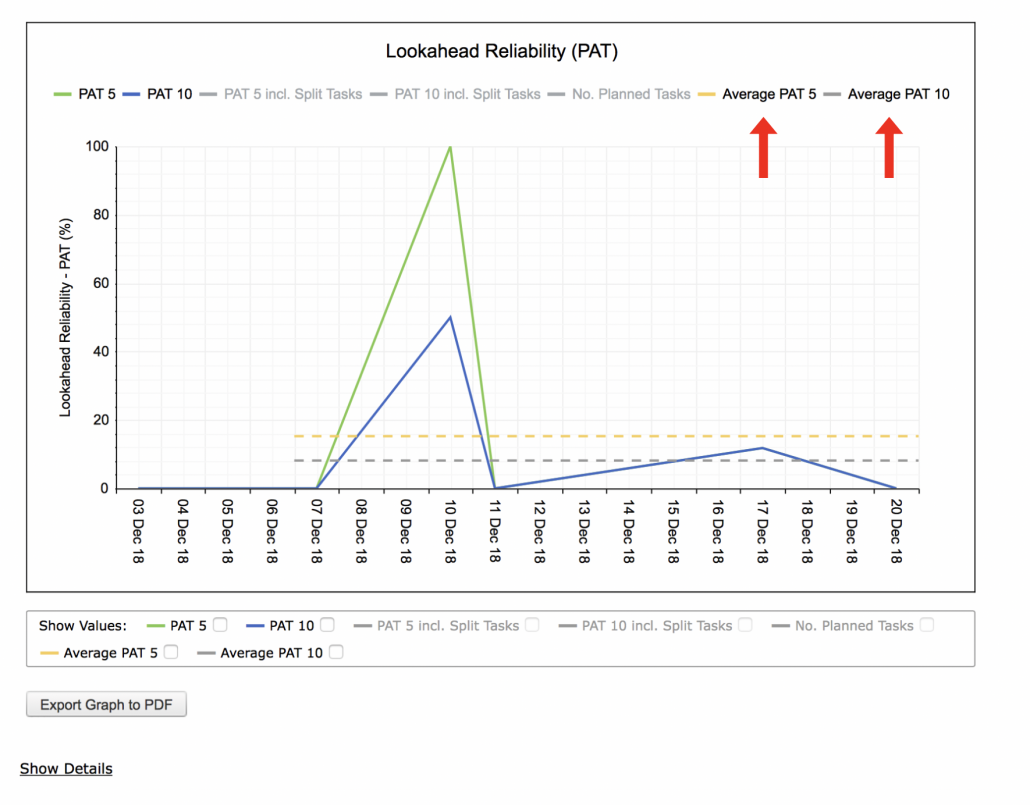
- When selecting any data range, users can elect to graphically display a line that represents the average Lookahead Reliability (PAT) values and quickly gain access to this information. For example, to display the Average PAT 5 line, select the ‘Average PAT 5’ legend element at the top of the chart. The same logic applies to the ‘Average PAT 10’ legend element.
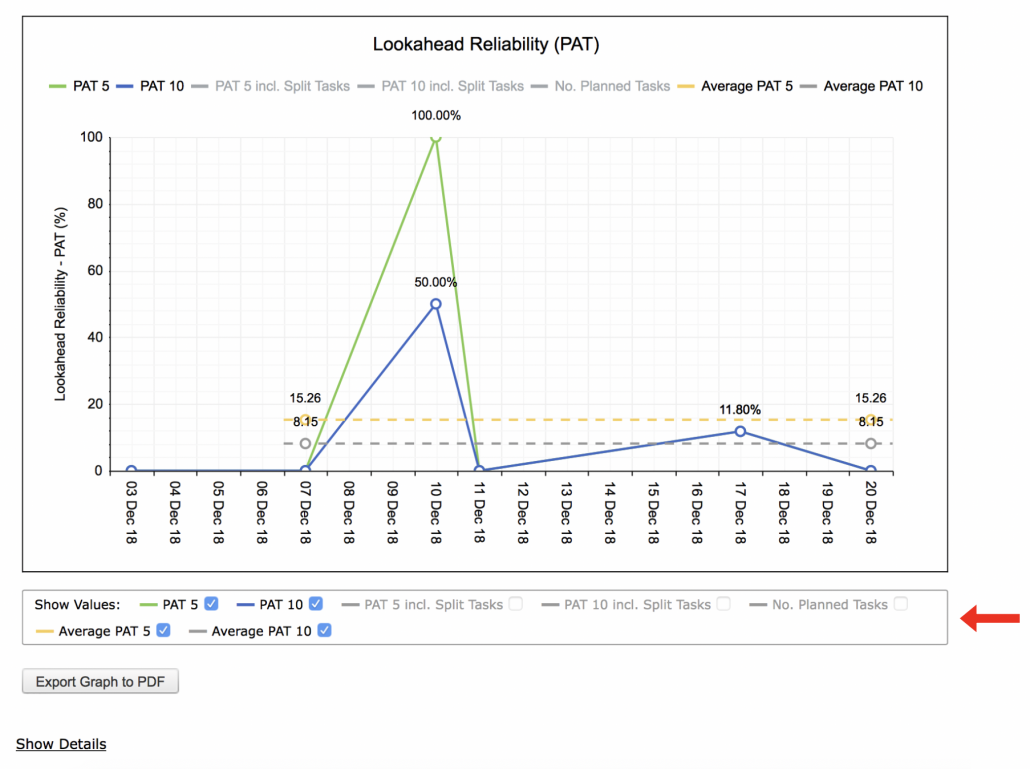
- If desired, the numerical values for all legend elements may be shown in the Lookahead Reliability (PAT) chart. To display these values, select the checkboxes in the ‘Show Values’ section underneath the PAT chart. Note that the legend element must first be activated and displayed in the chart to be able to select the ‘Show Values’ checkbox for that legend element.
- In addition to viewing Lookahead Reliability (PAT) for a single team, to view an aggregate Lookahead Reliability (PAT) for all teams, select All under the Team drop-down.This feature plots one data point for all Production Plans within the selected date range, and thus shows the overall percentage of reliability to forecast work across the project over time.
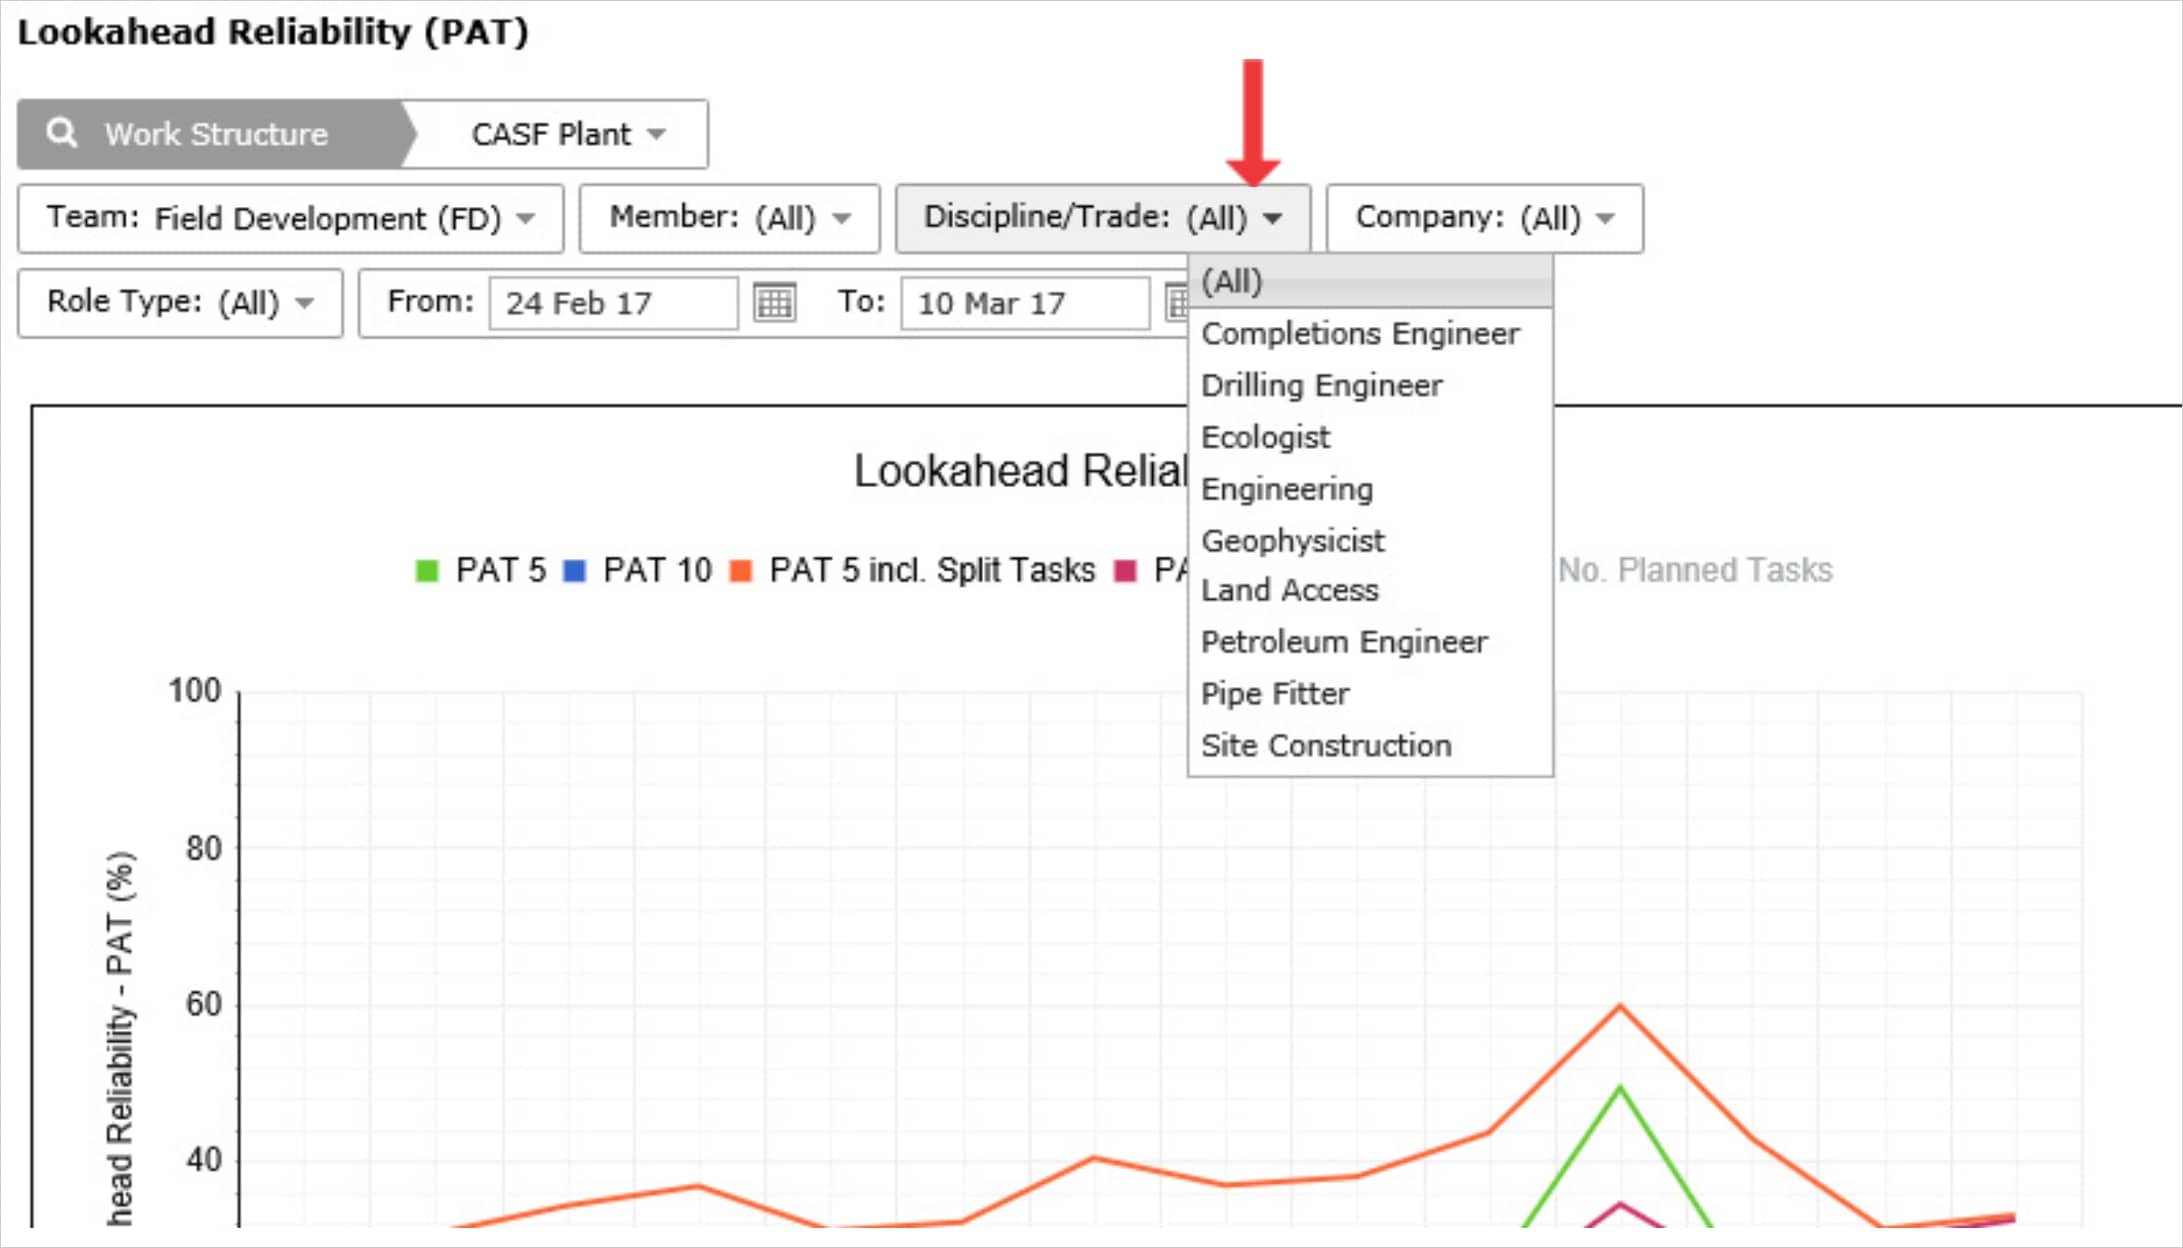
- You can also filter by Member, Company, Discipline / Trade and Work Structure.
- To export Lookahead Reliability (PAT) to a PDF file, click the Export Graph to PDF button and follow the prompts according to the specific browser you are using.
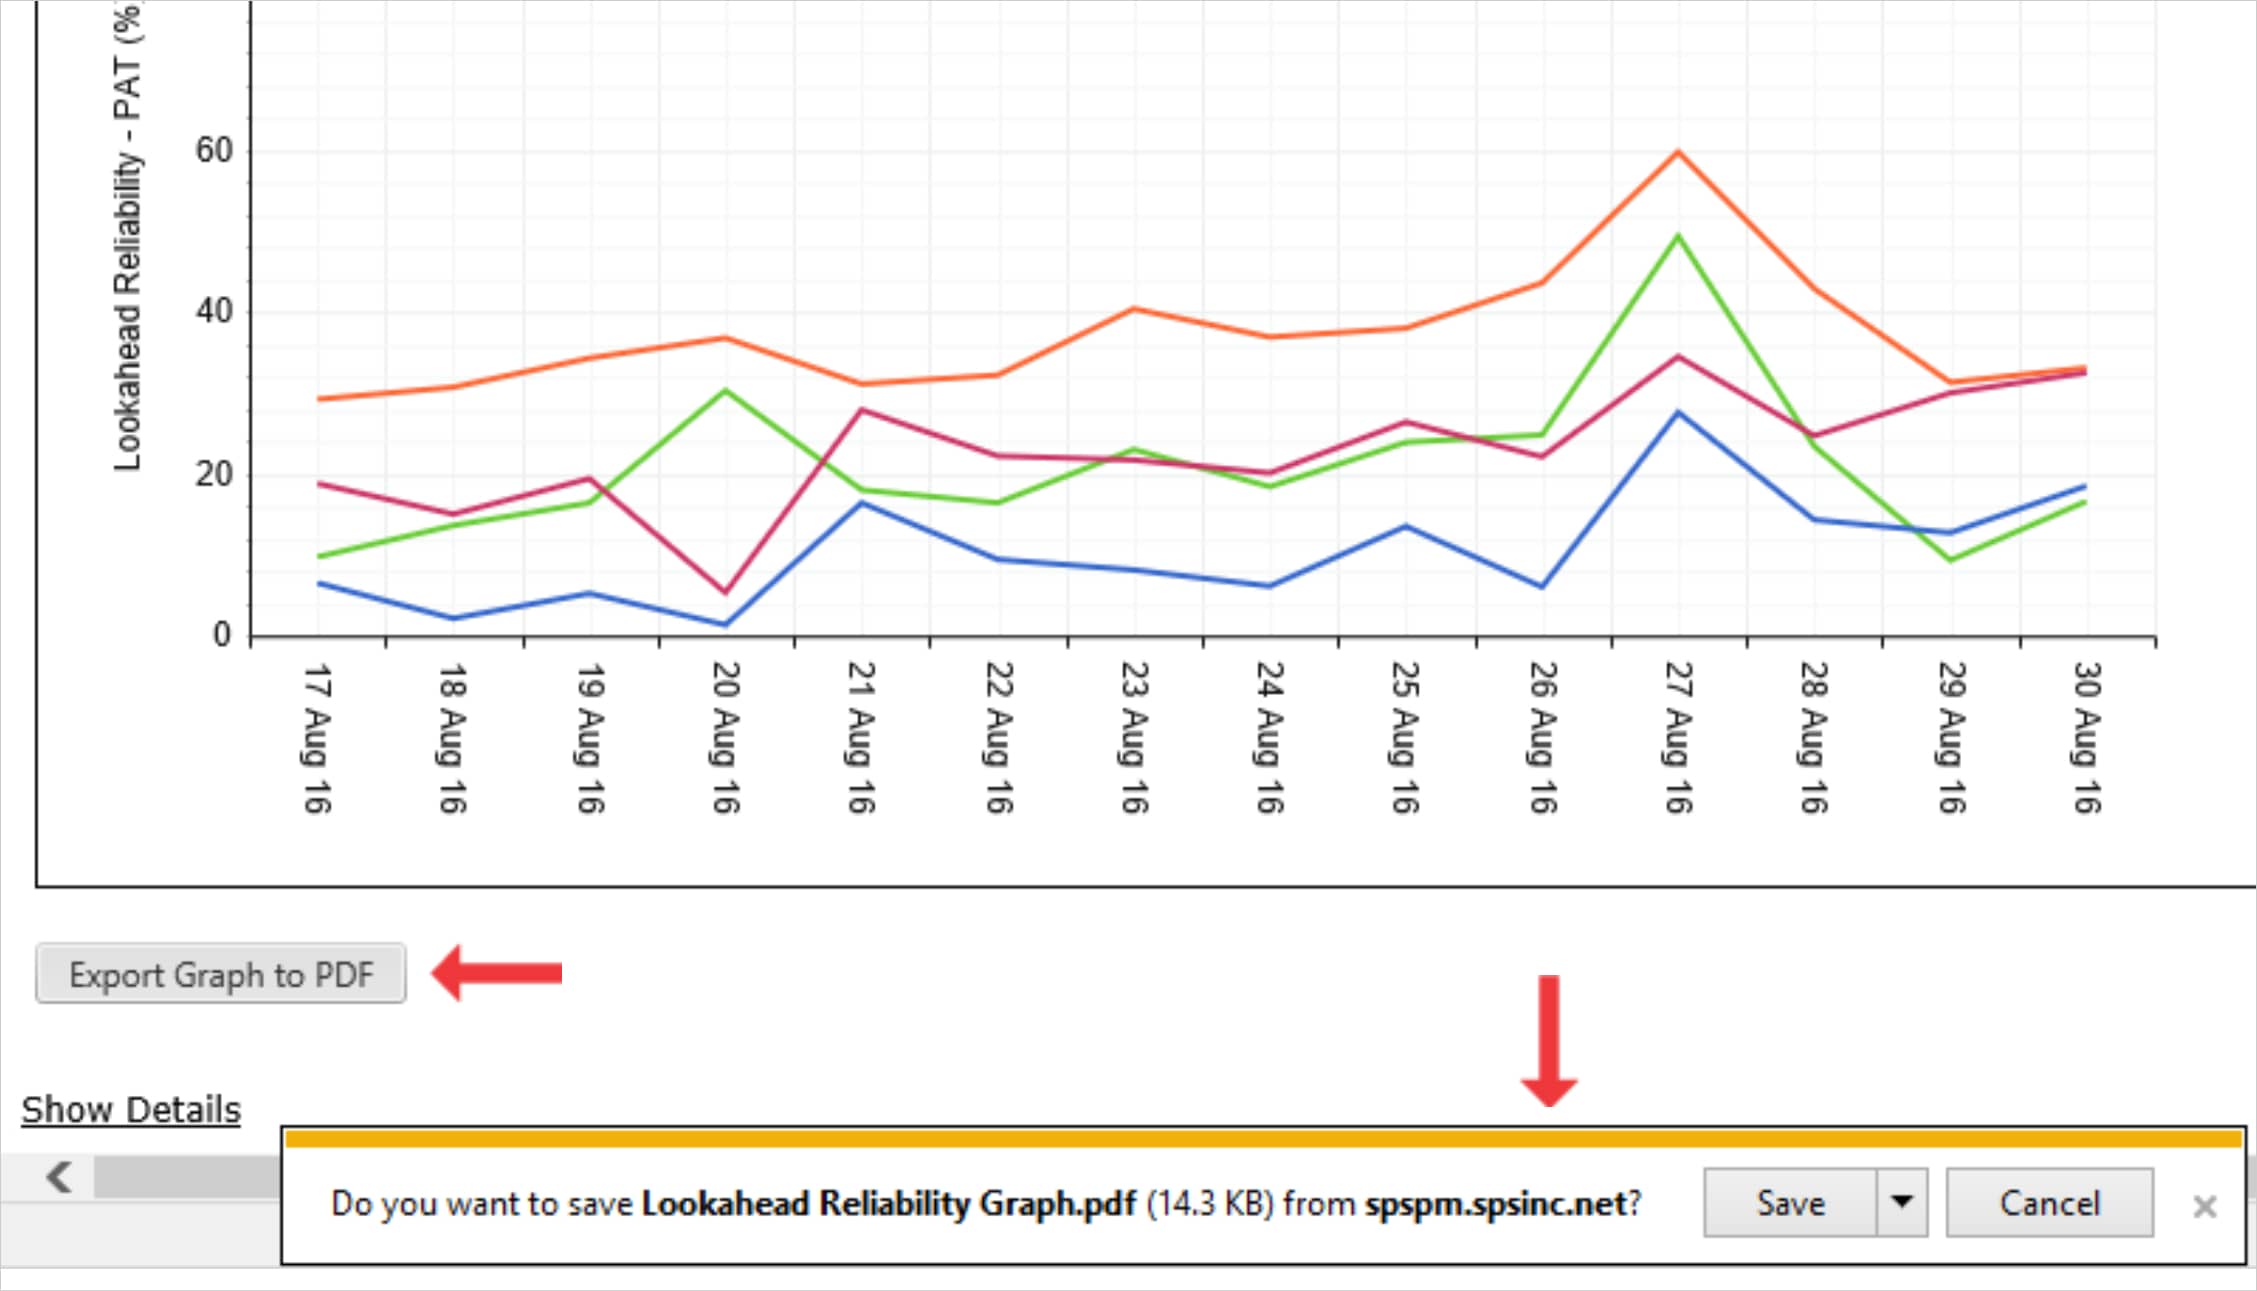
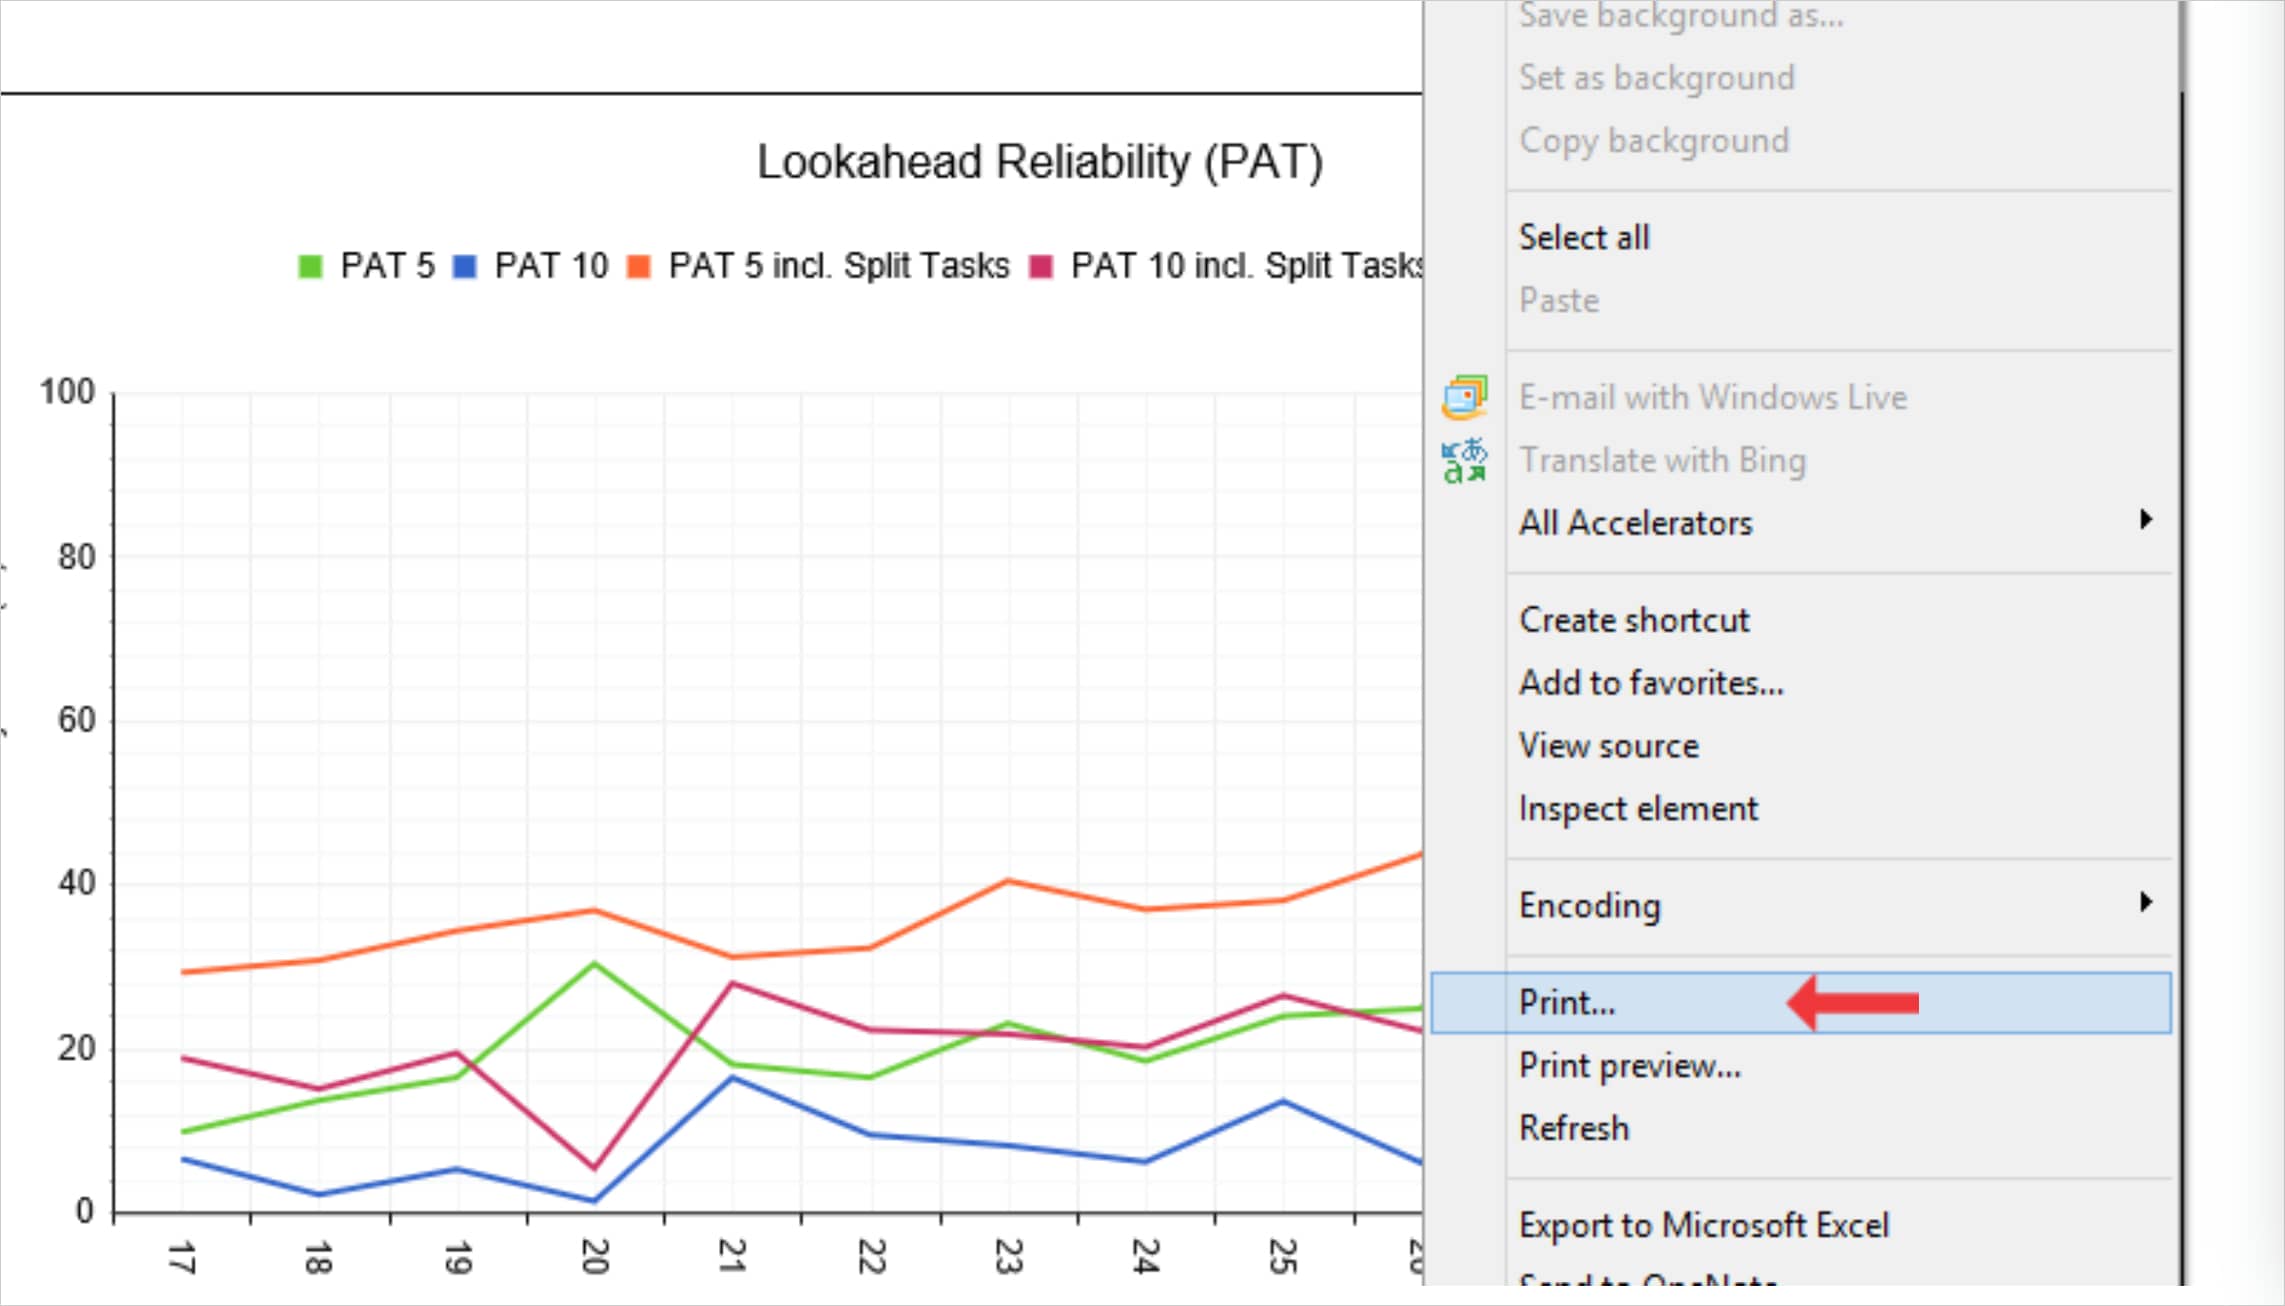
- To print Lookahead Reliability (PAT), options may differ based on your browser. For instance, if you are using Internet Explorer, right click in the white space outside of the Production Plan Analysis graph and select Print from the menu or simultaneously press the Ctrl and P keys on your keyboard.
- The Print Dialogue box opens.
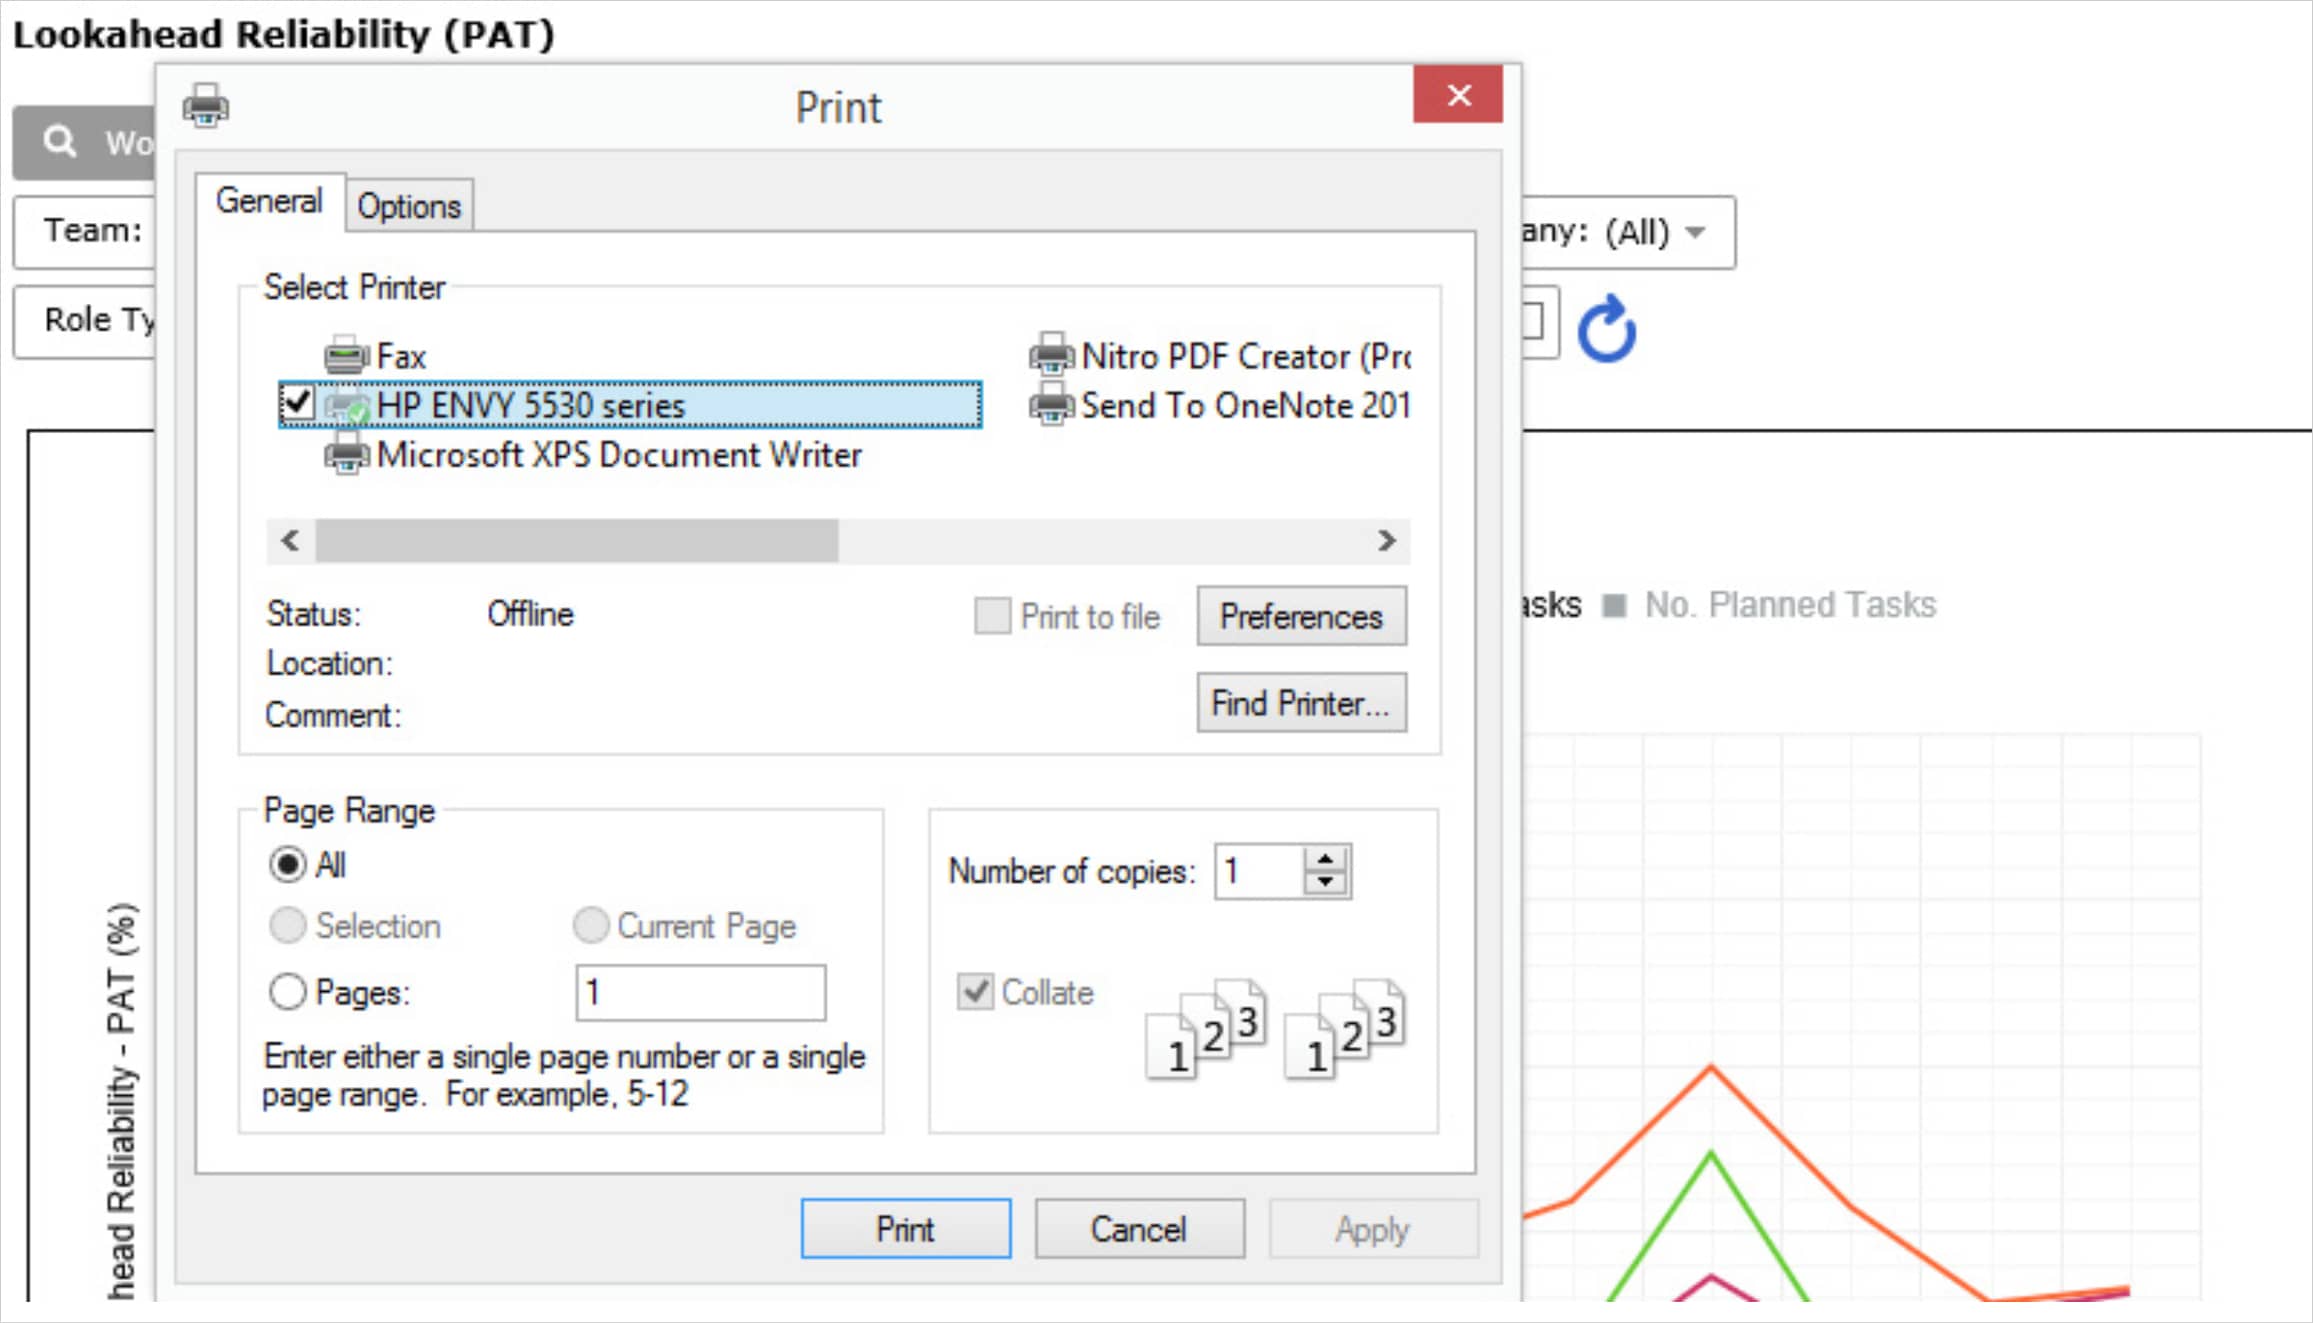
- Using the Print Dialogue box, change any desired print settings. Once all relevant printing settings have been modified, click the Print button.Note: Before printing, it is recommended you confirm the fit to the desired paper size.