
Understanding capacity requirements for upcoming work and determining if the available capacity is effectively used during each Planning Horizon (e.g., day or week) is critical to ensure that workflows as planned.
Capacity Commitment Reliability describes how well capacity has been used for any given Production Plan by measuring how much of the planned capacity is actually utilized. Therefore, 100% Capacity Commitment Reliability should always be targeted. A capacity buffer should be used to absorb any unforeseen variability, and thereby increase the likelihood of achieving 100% reliability.
Capacity Commitment Reliability answers the question, “Is capacity being used as planned?” If it is, the project team should analyze whether this is achieved at the cost of a large capacity buffer. If so, the capacity buffer should be reduced to the appropriate level.
Note: As types of capacity are labor, equipment, and space, the standard configuration of SPS|PM uses labor capacity (Man-Days / Man-Hours) as the means to calculate Capacity Commitment Reliability. A similar analysis can be performed for the use of equipment and / or space; contact your System Administrator to discuss specific configurations for these two types of capacity.
To access Capacity Commitment Reliability, complete the steps below:
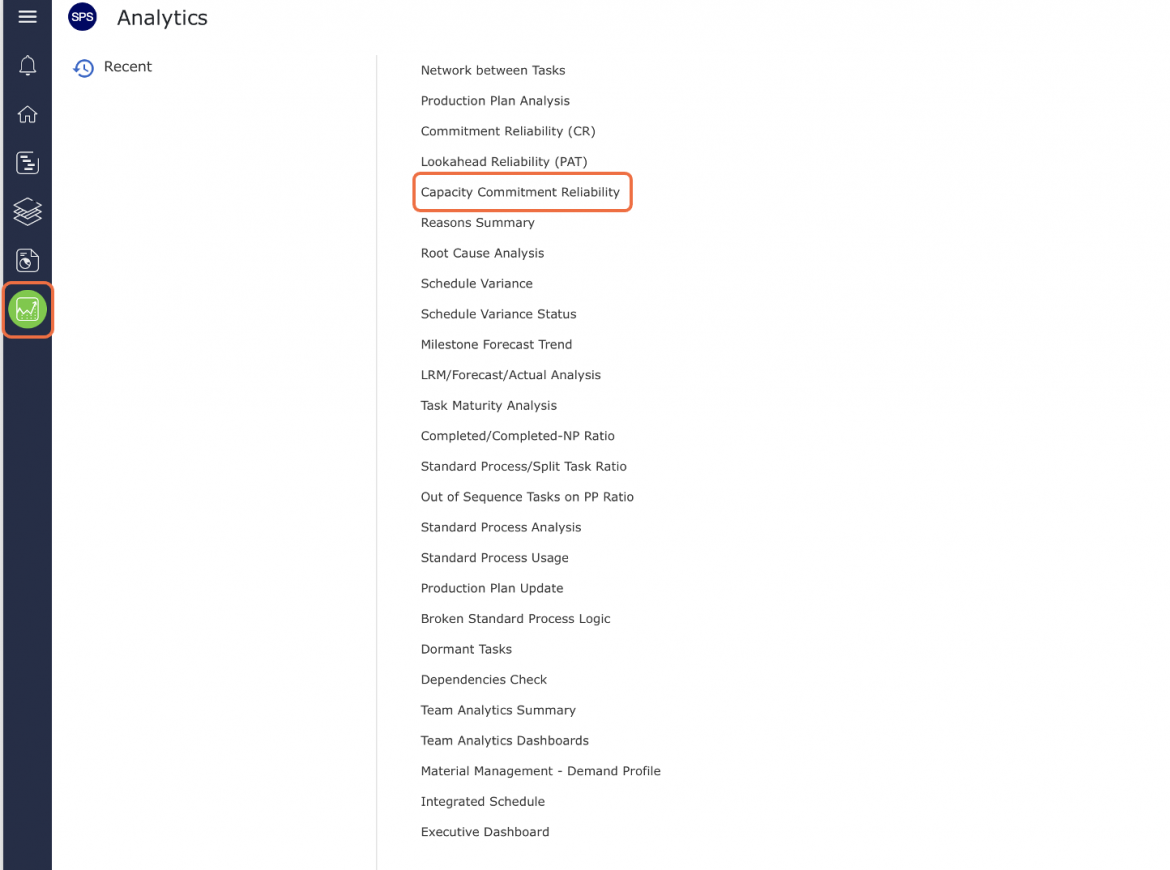
- From the Main Navigation Bar select Analytics, then select Capacity Commitment Reliability.
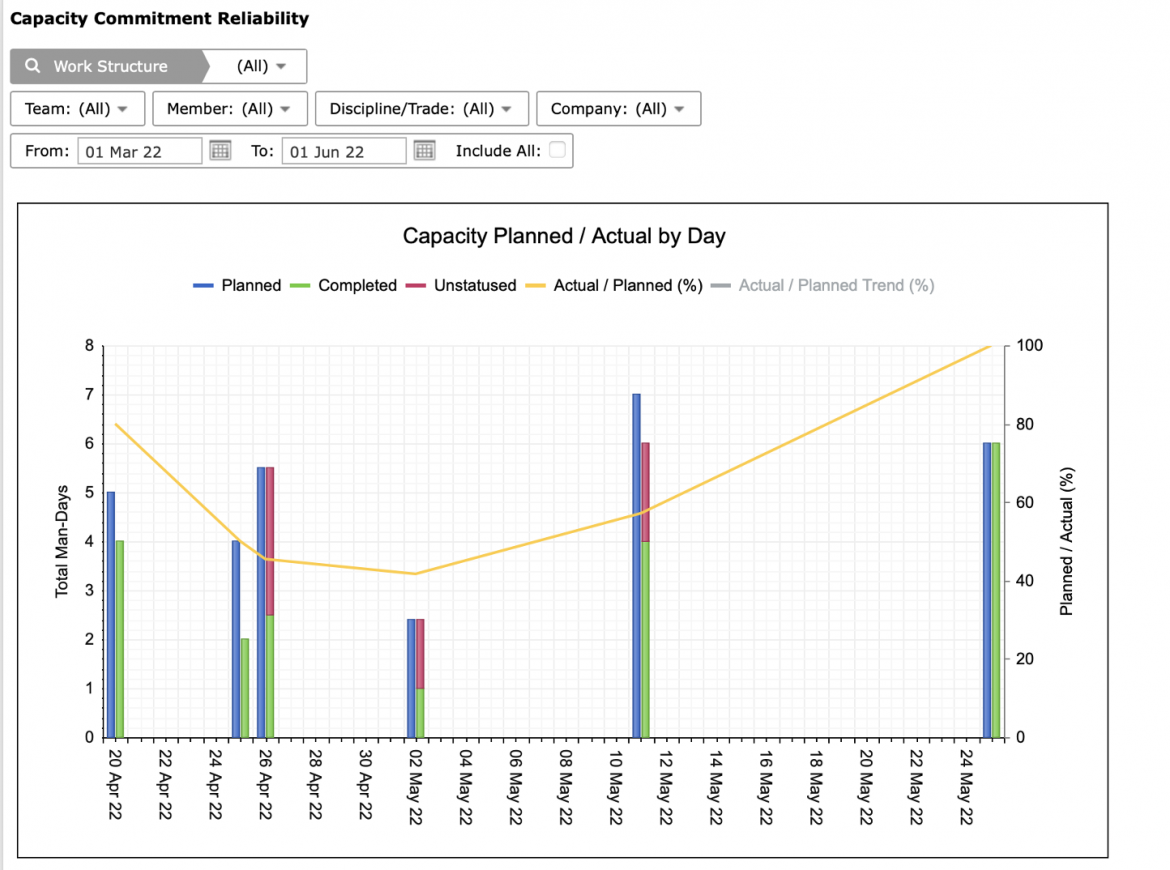
- Capacity Commitment Reliability opens in a new window and automatically displays the Analytic for the team selected under the Team Menu with the default date range of two weeks from the current date.
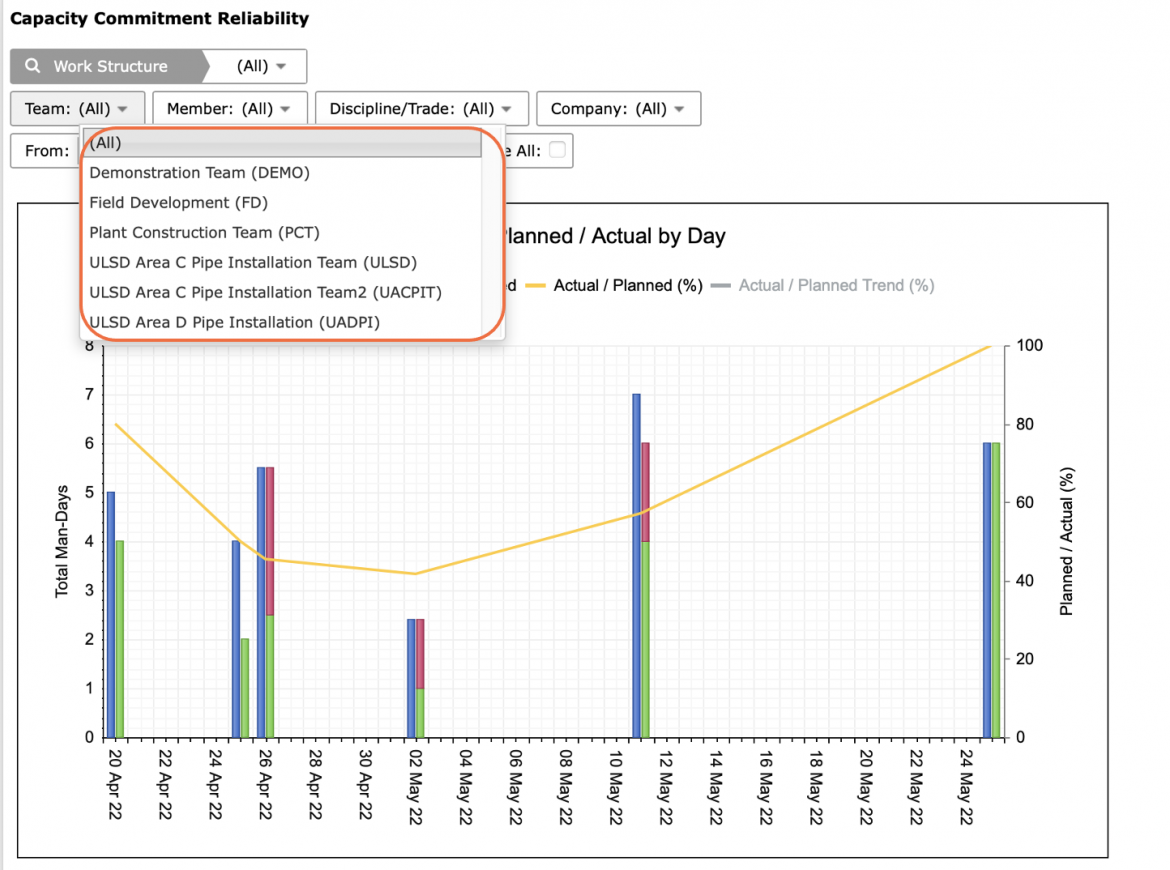
- To view Capacity Commitment Reliability for another team or all teams, select the desired team or All under the Team drop-down.
The All feature totals the utilization for all teams to show global capacity utilization issues across the project.
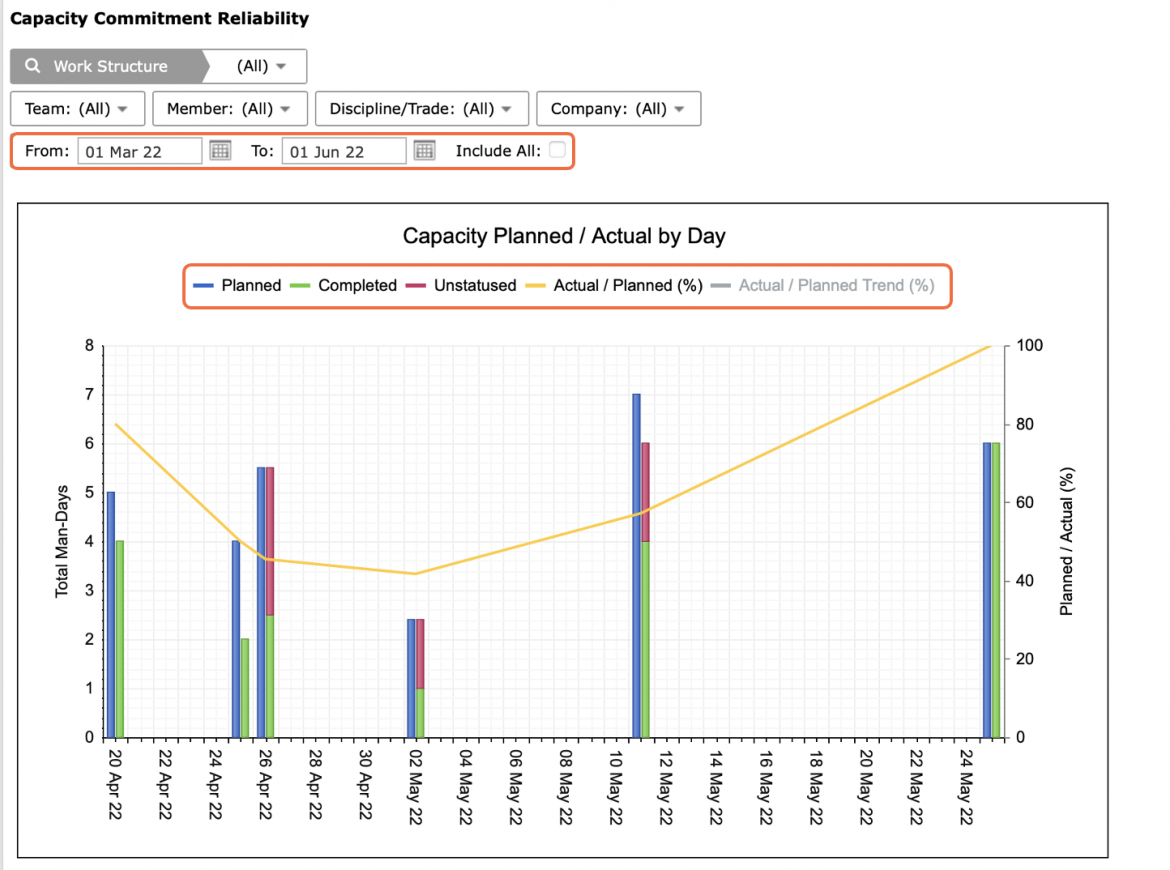
- If a different date range is desired, or no data is visible, adjust the From and To dates or check: Include All, to show all historical data.
The legend elements: Planned, Completed, Unstatused, Actual / Planned (%), and Actual / Planned Trend (%) are clickable and toggle to display / hide data.
- Also use the Pin icon in the top right of the graph to include Capacity Commitment Reliability in your Dashboard.
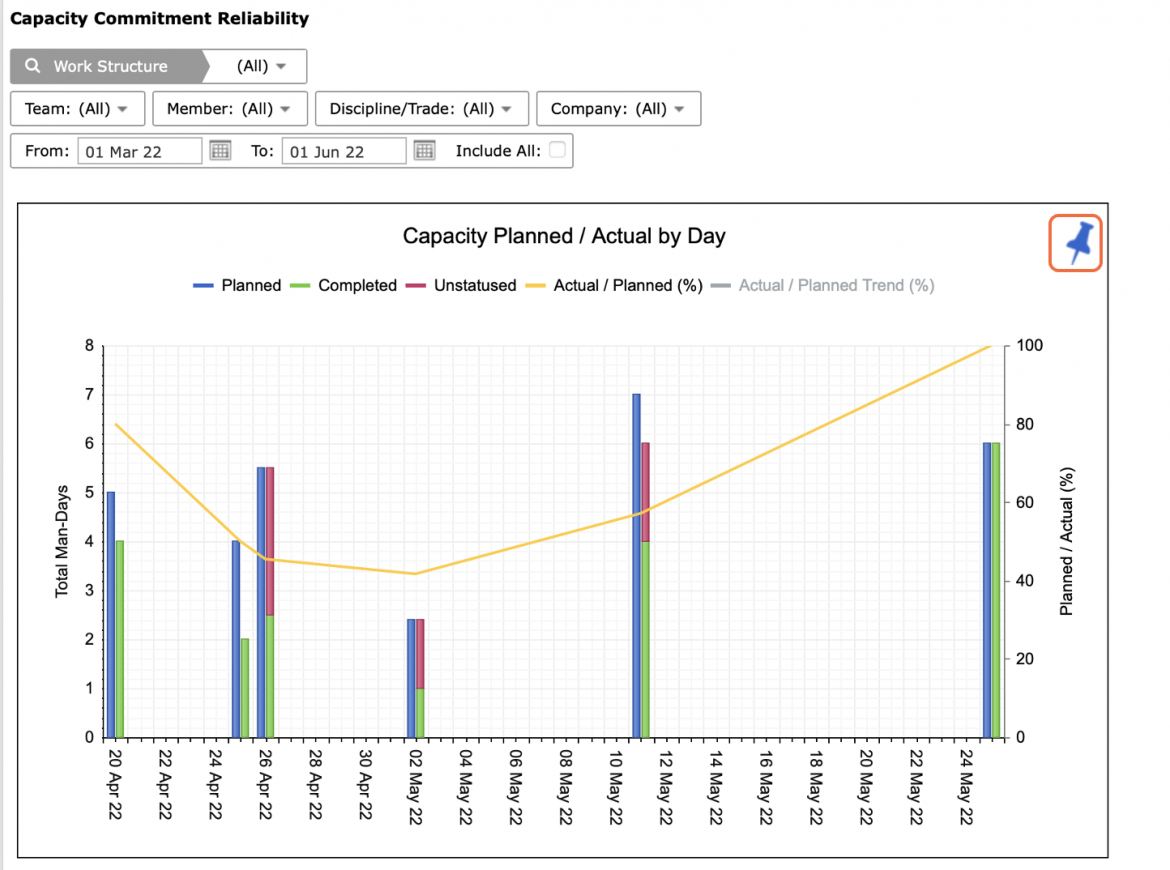
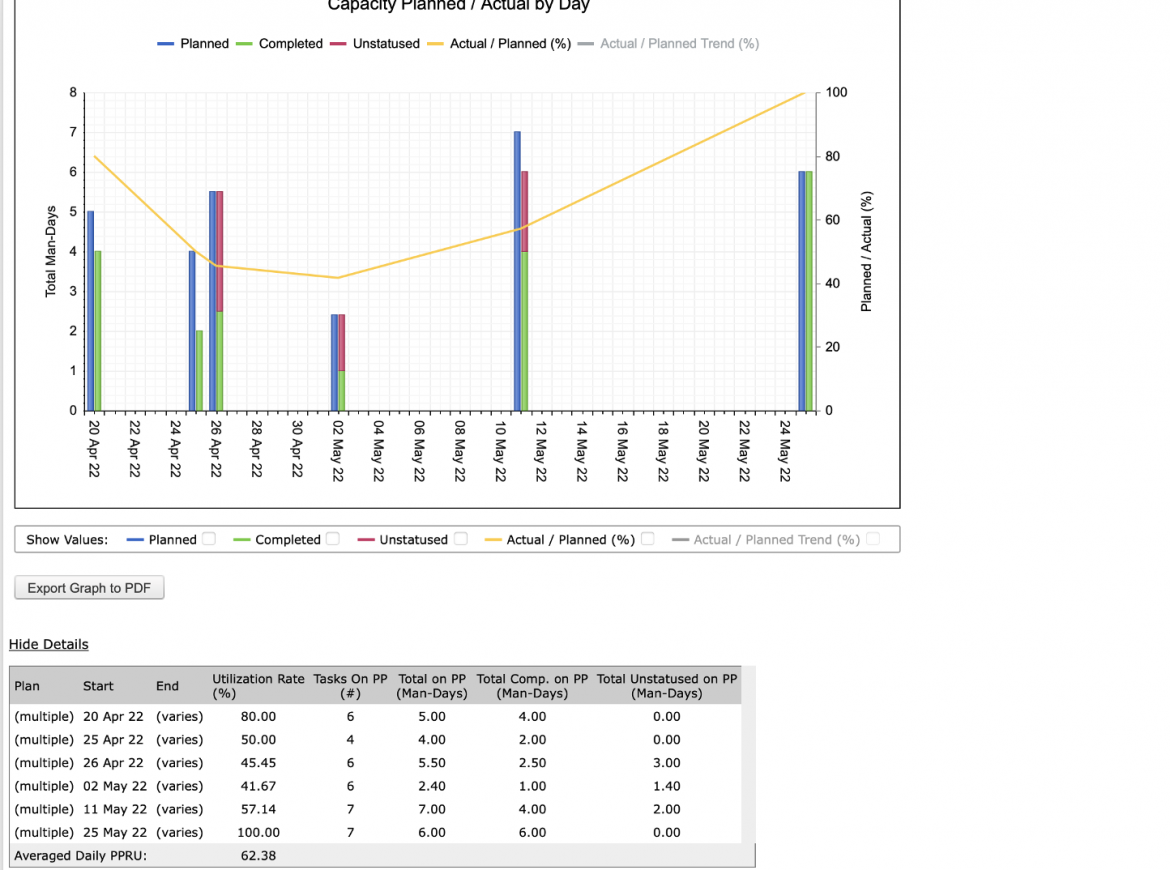
- For the selected team(s), Capacity Commitment Reliability displays a column for every Production Plan comparing the total number of Man-Days planned (blue column) on each Production Plan versus the number of Man-Days associated with the completed tasks (green column).
Capacity Commitment Reliability also shows the number of Man-Days associated with unstatused tasks (red column), which only displays when Unstatused tasks exist, and the percentage of actual versus planned tasks (yellow line).
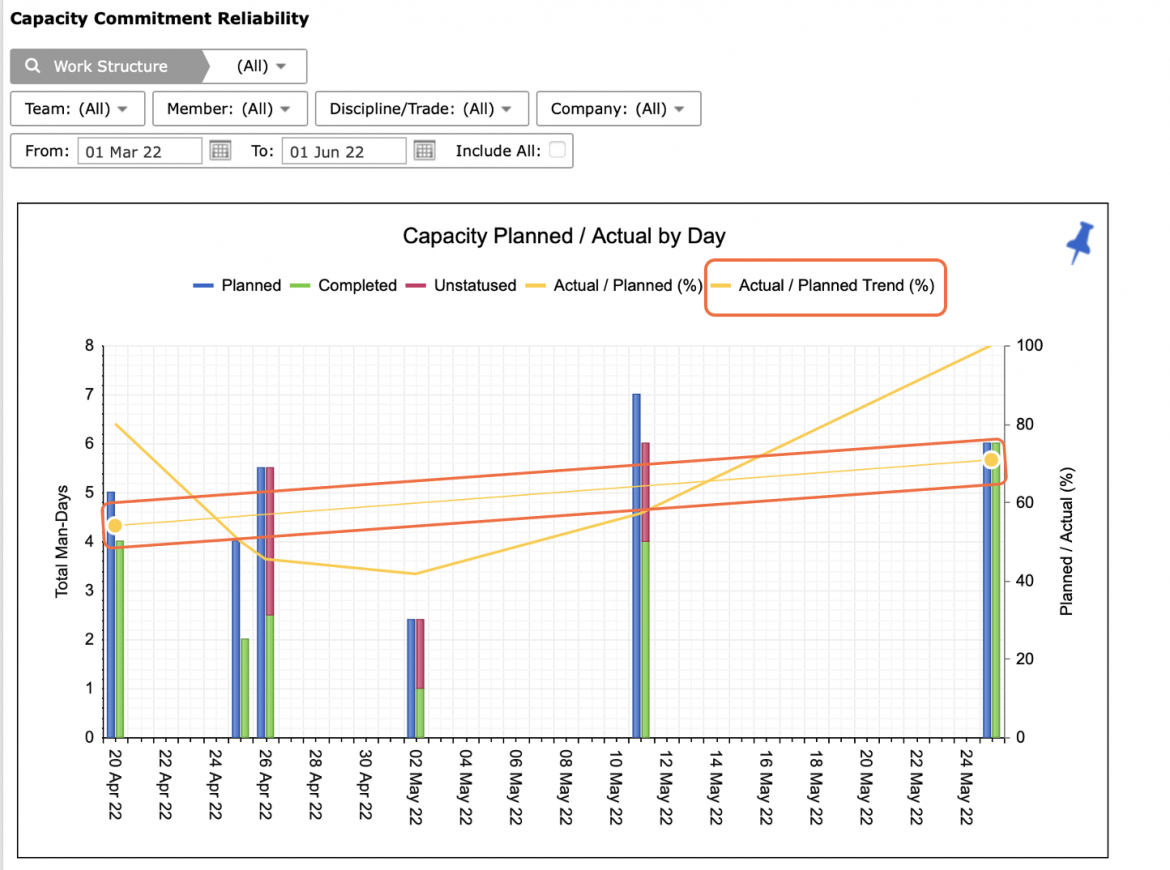
- To view the trend for the percentage of planned versus actual for each Production Plan click: Actual / Planned Trend (%), in the graph legend.
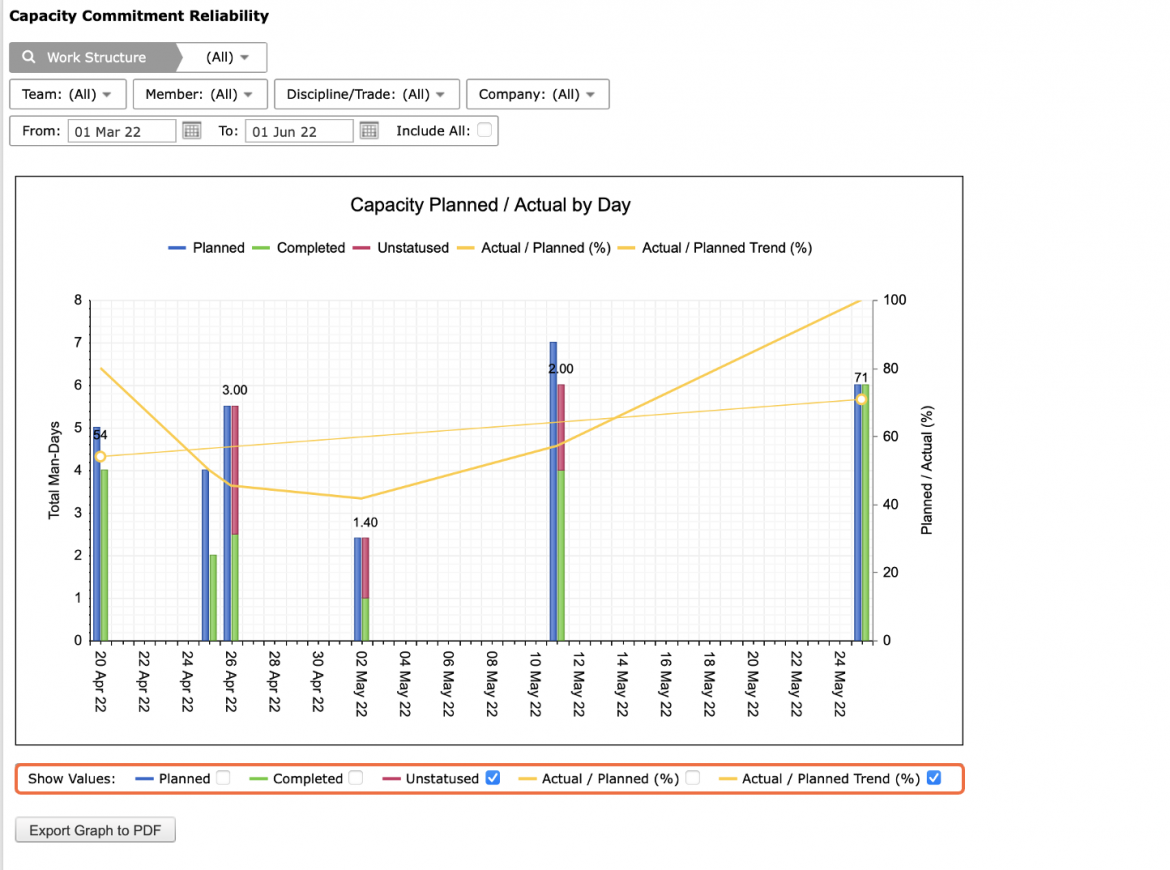
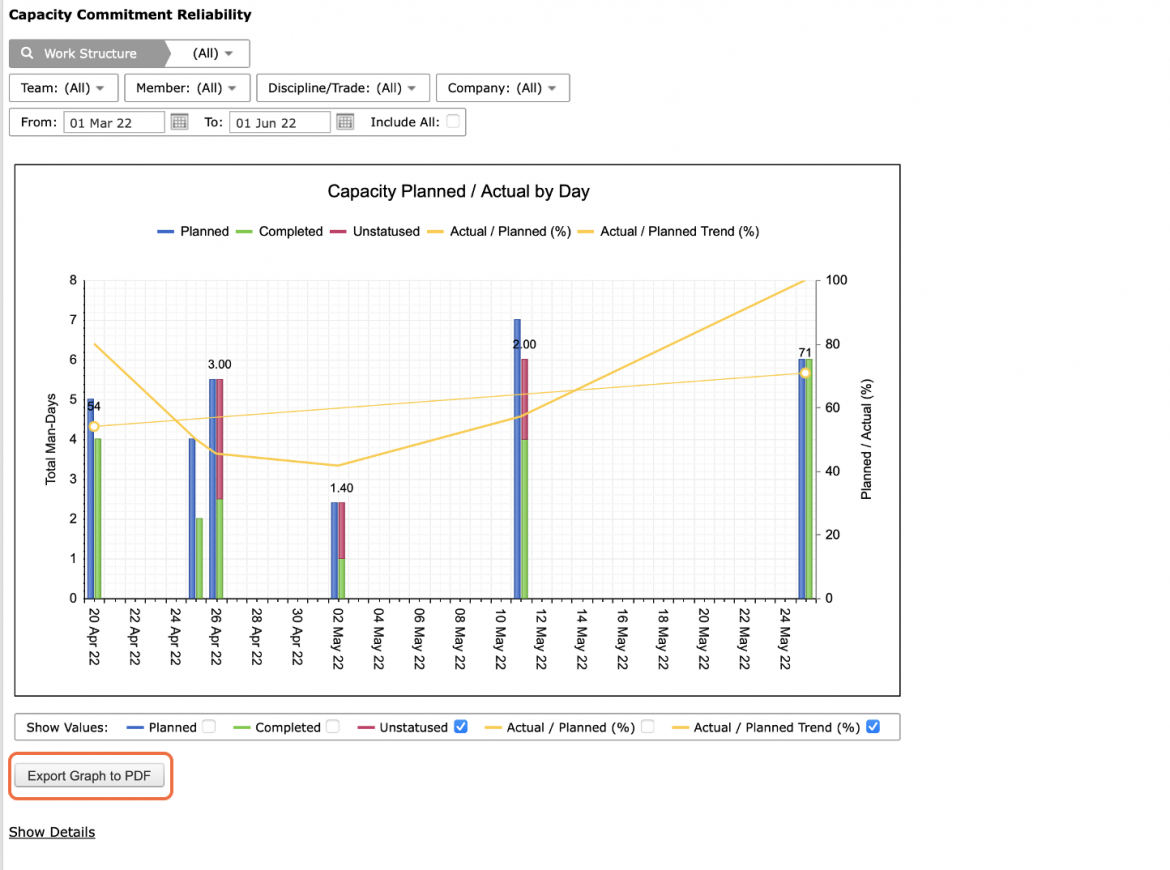
- If desired, the numerical values for all legend elements may be shown for Capacity Commitment Reliability in the Capacity Planned / Actual by Day chart. To display these values, select the checkbox in the ‘Show Values’ section underneath the chart. Note that the legend element must first be activated and displayed in the chart to be able to select the ‘Show Values’ checkbox for that legend element.
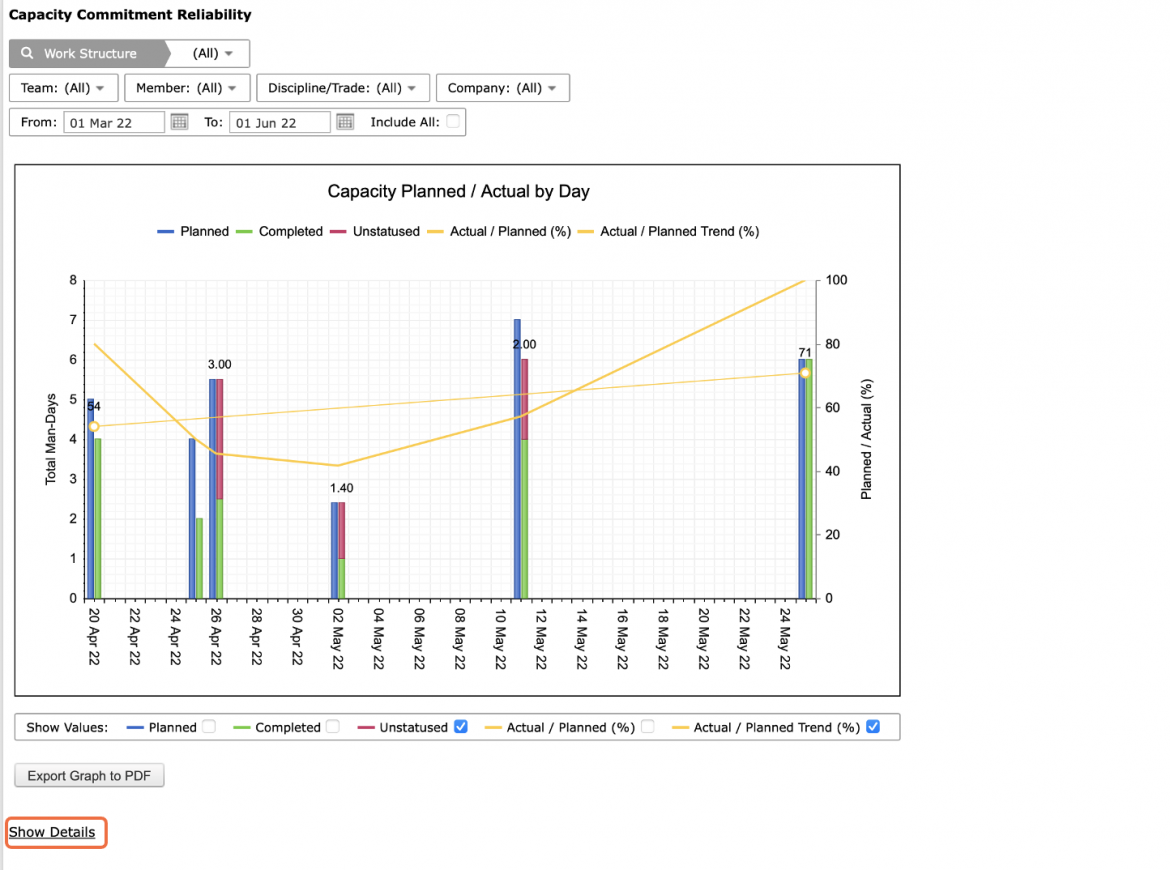
- To view the data behind the Capacity Commitment Reliability click: Show Details, beneath the graph. To hide the data click: Hide Details.
For each individual Production Plan, the data table lists the Start and End dates of the Plan, the Utilization Rate (%), number of Tasks on the Plan, Total Man-Days per Plan, Total Man-Days completed per Plan, and total Man-days associated with unstatused tasks. The average Production Plan Resource Utilization (PPRU) Rate is also shown at the bottom of the table.
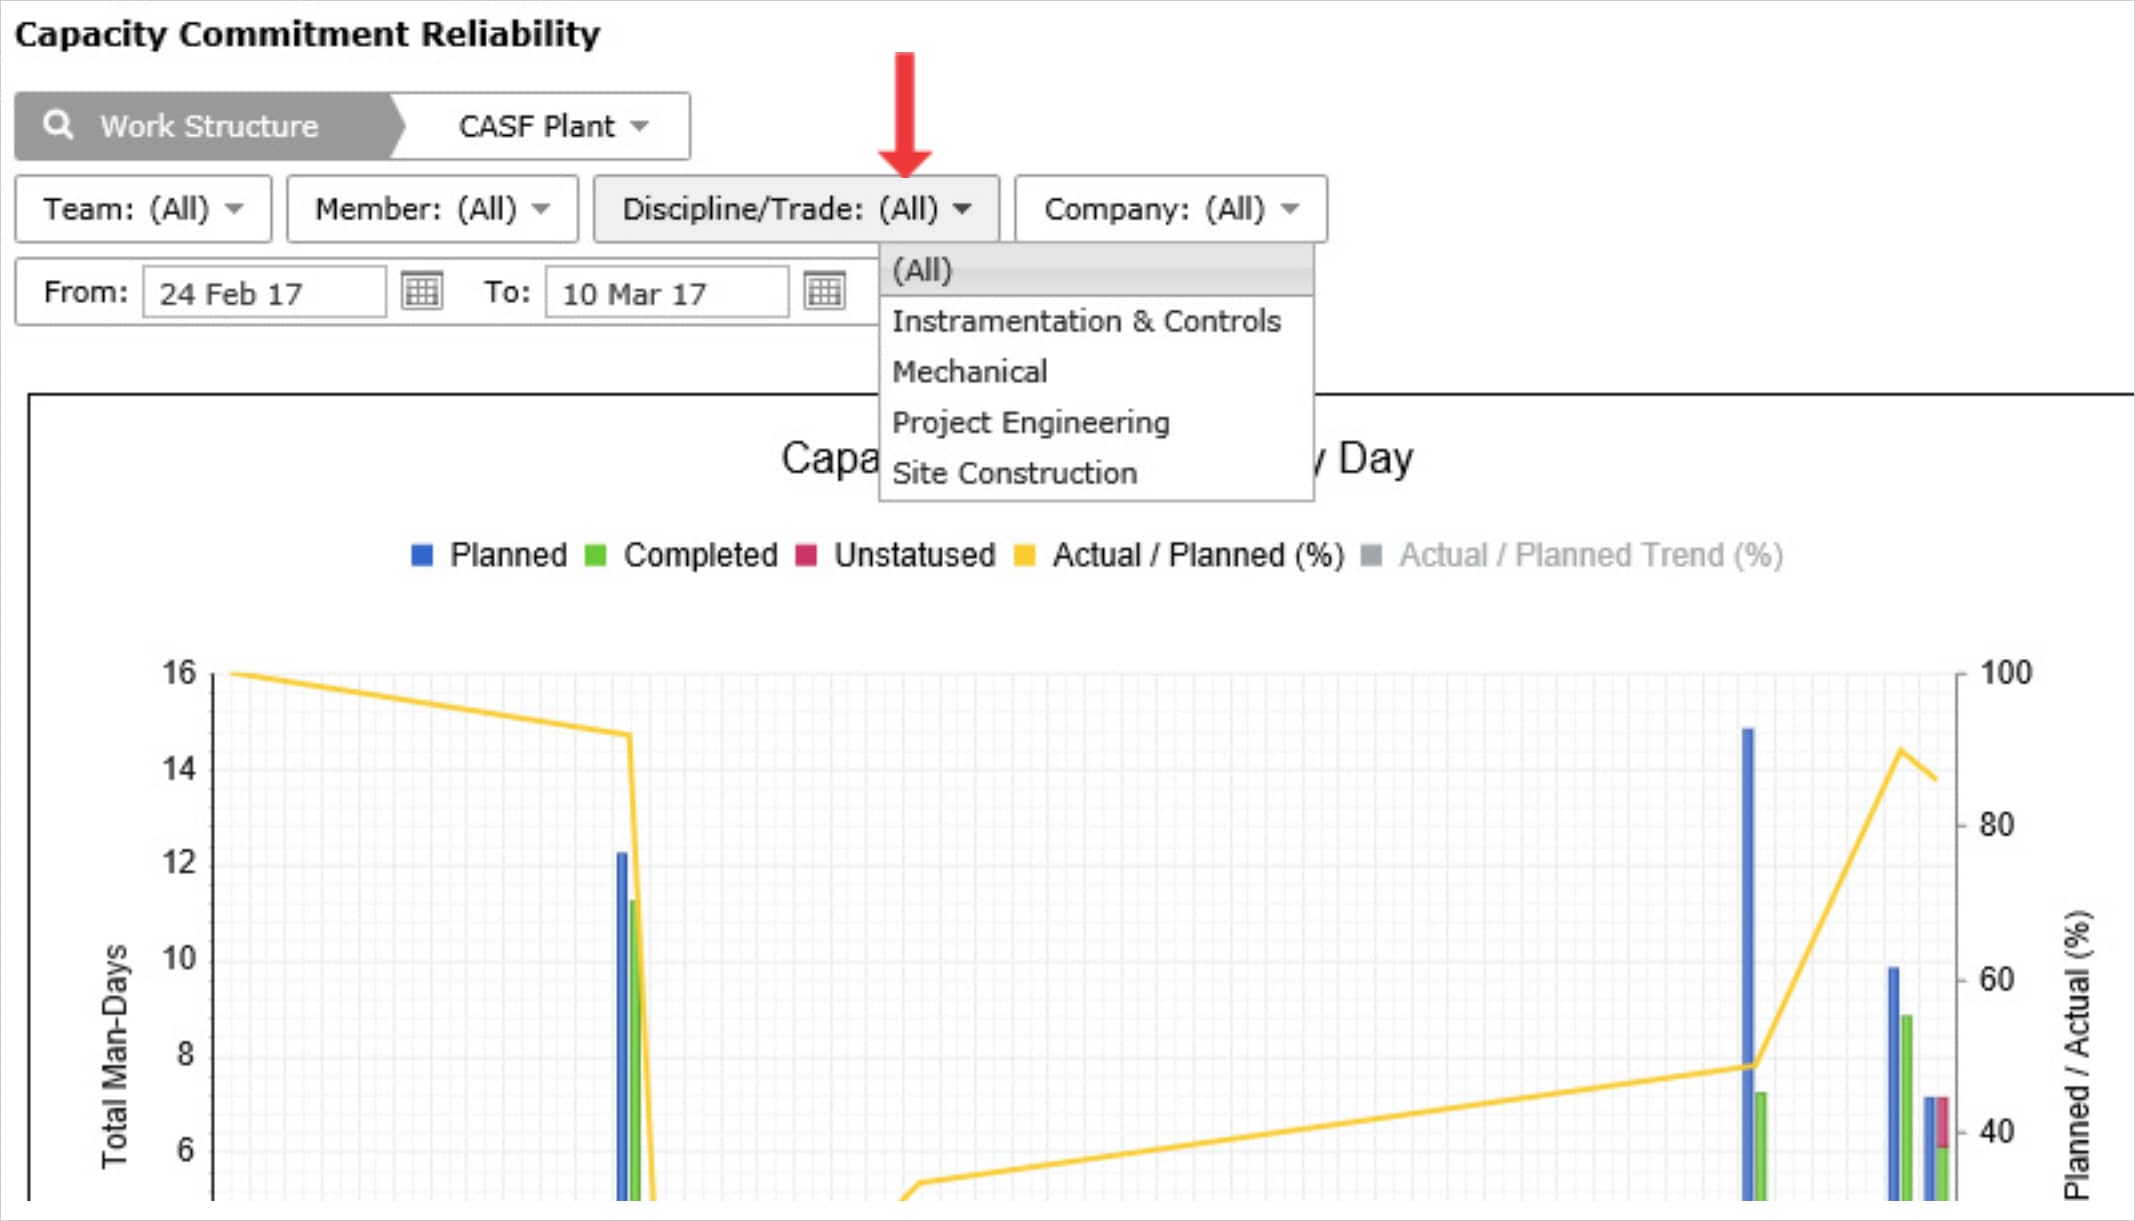
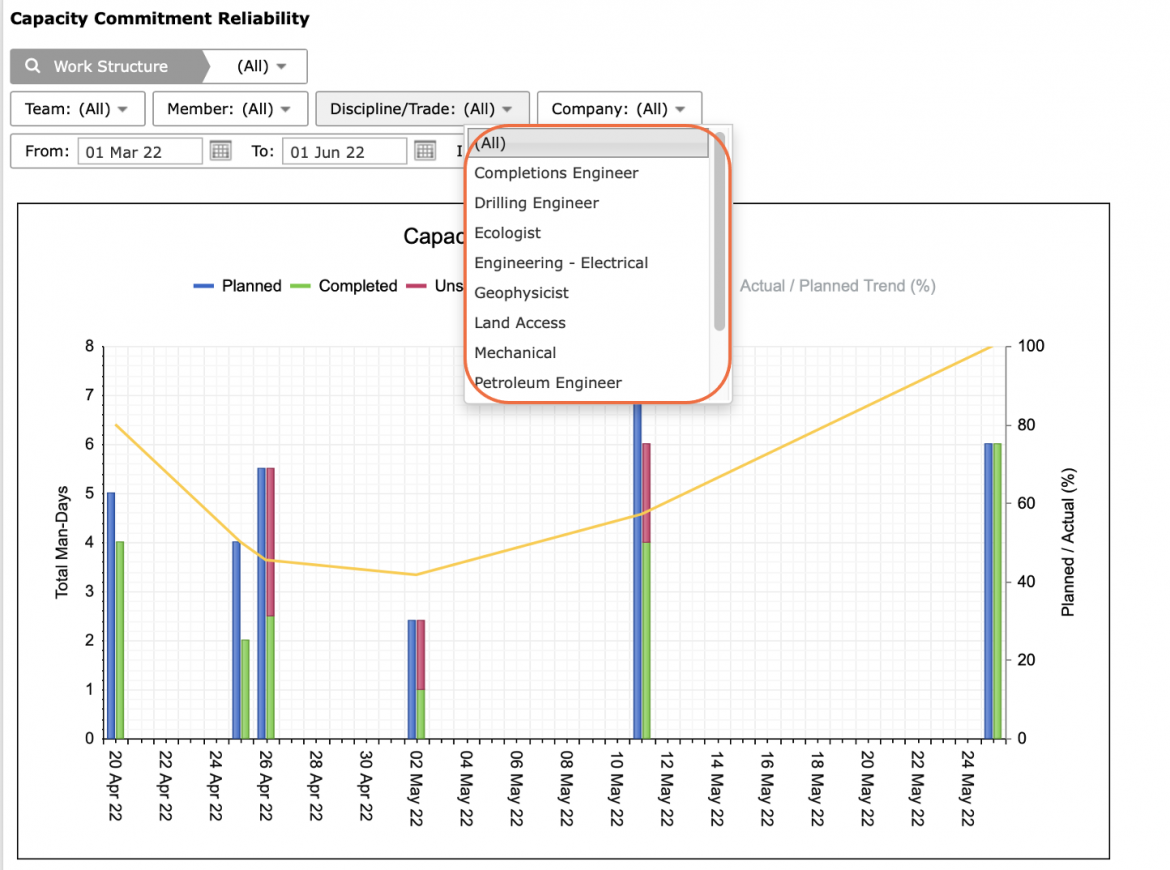
- You can also filter by Member, Company, Discipline / Trade, and Work Structure.
- To export Capacity Commitment Reliability to a PDF file, click the Export Graph to PDF button and follow the prompts according to the specific browser you are using.
- To print Capacity Utilization, options may differ based on your browser. For instance, if you are using Internet Explorer, right-click in the white space outside of the Capacity Commitment Reliability graph and select Print from the menu or simultaneously press the Ctrl and P keys on your keyboard.
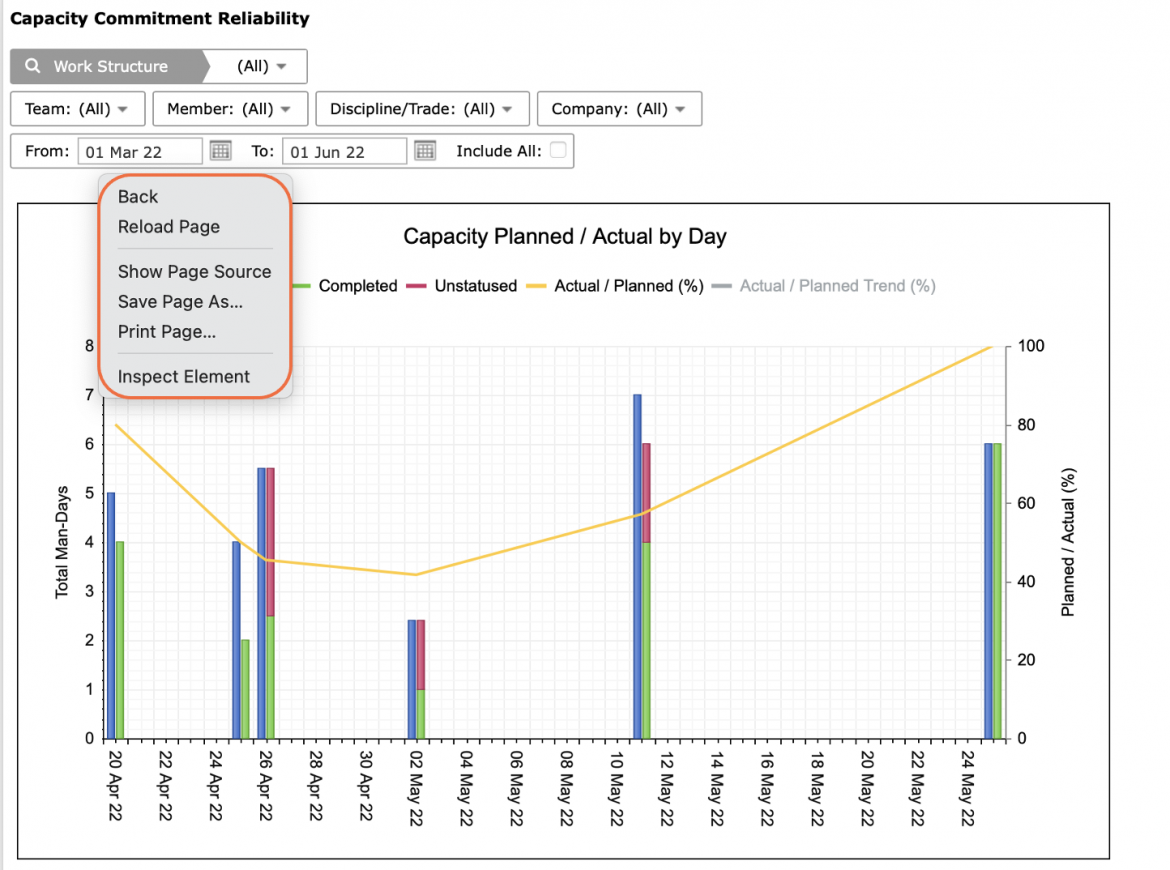
- The Print Dialogue box opens.
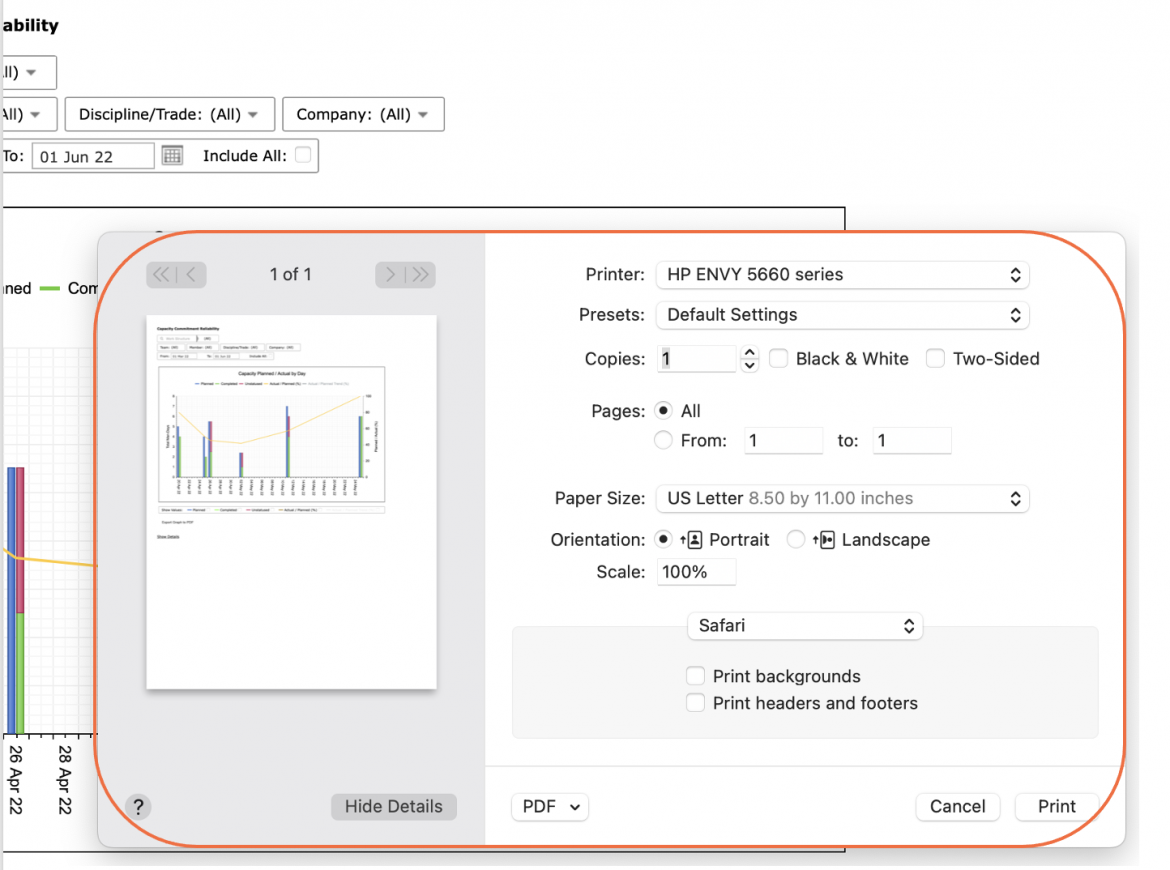
- Once all relevant printing settings have been modified, click the Print button.
Note: Before printing, it is recommended you confirm the fit to the desired paper size.