
Since variability is always present in any production system including those of projects, understanding the actual sources of variability and the level of reoccurrence is key to developing action plans to mitigate its impact, and therefore, contribute to performance improvements.
Reasons Summary provides the foundation to implement Performance Improvement efforts using a Pareto Analysis (80 / 20 rule) to determine the primary reasons for non-completion of tasks and to implement corrective actions that can significantly improve reliability (thereby reducing variability and the associated buffers). Exposing reasons for task non-completion enables teams to perform more robust constraint analysis during Production Planning and Scheduling sessions.
Reasons Summary measures why work is not completed as planned using pre-defined root cause categories. Since root causes of variability are typically different due to the inherent complexity of the work, categories for task non-completion can be customized under the four options, and standardized to evaluate reoccurrence. For information on how to create and modify the categories, see Manage Root Cause Categories within Administration.
Reasons Summary enables project teams to gain insight into the actual sources of variability and the level of reoccurrence for task non-completion and the corresponding level of reoccurrence through a graphical representation of the total number of task non-completions for each Root Cause Category over a given period of time.
Reasons Summary answers the questions, “What reoccurring issue(s) is the project team experiencing that can be addressed,” and “What actions need to be taken to eliminate recurrence?”
To access Reasons Summary, complete the steps below:
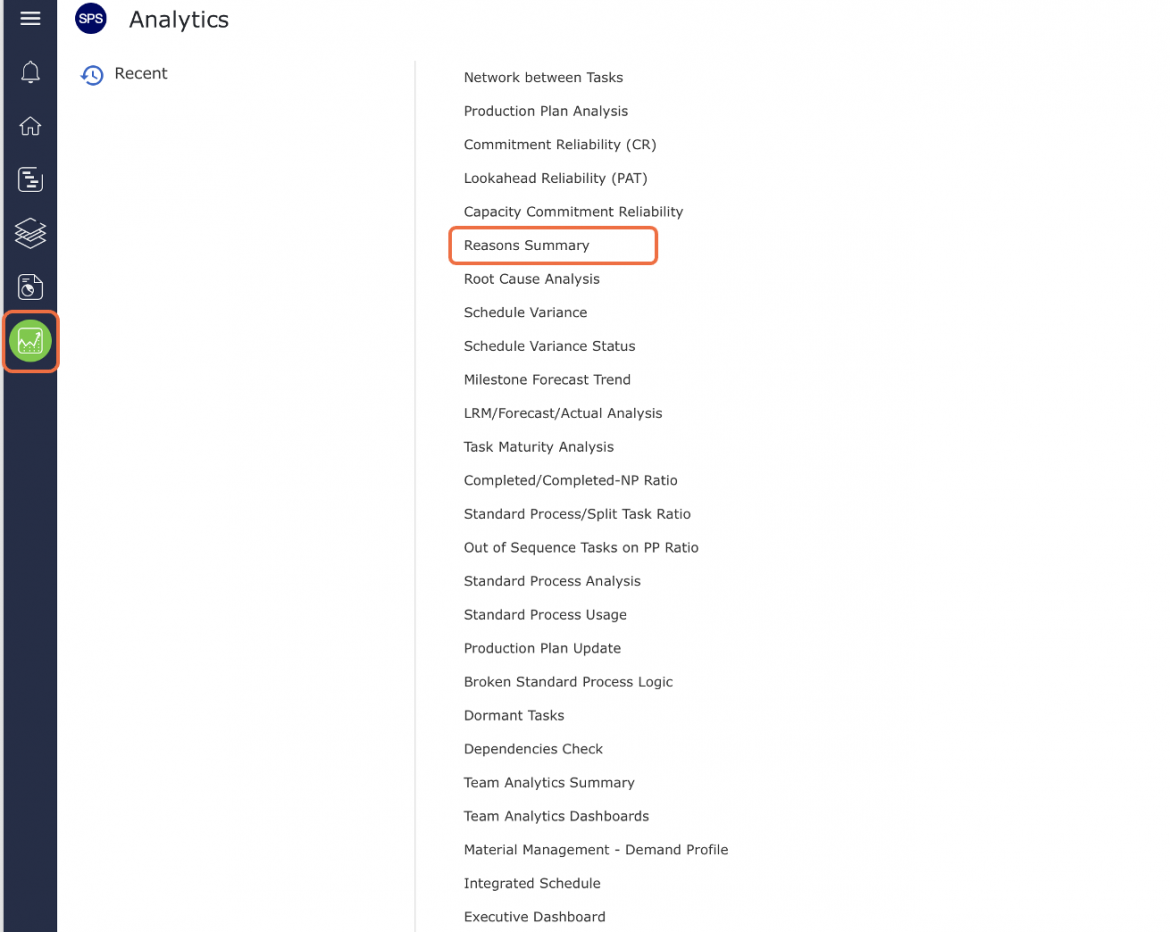
- From the Main Navigation Bar select Analytics, then select Reasons Summary.
- Reasons Summary opens in a new window and automatically displays the Analytic for the team selected under the Team Menu with the default date range of two weeks from the current date.
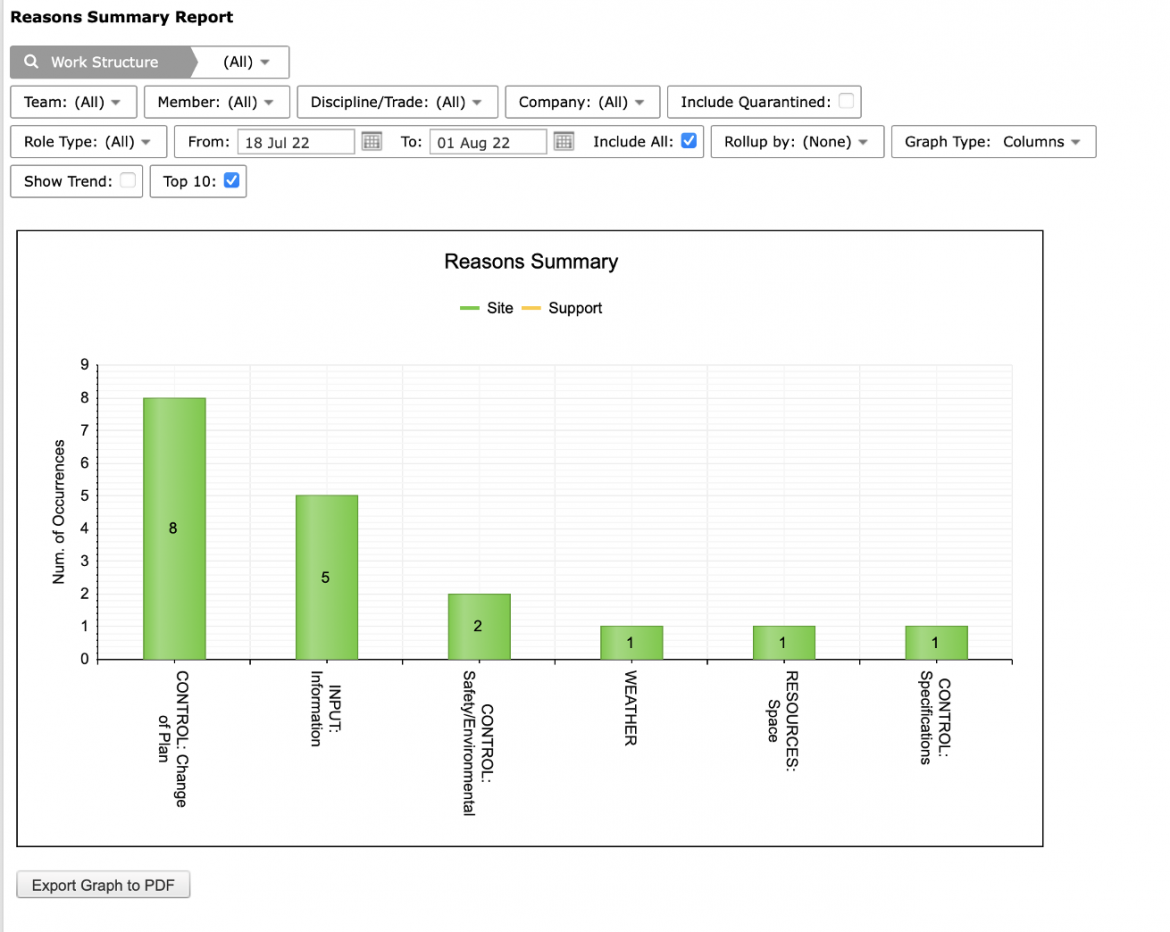
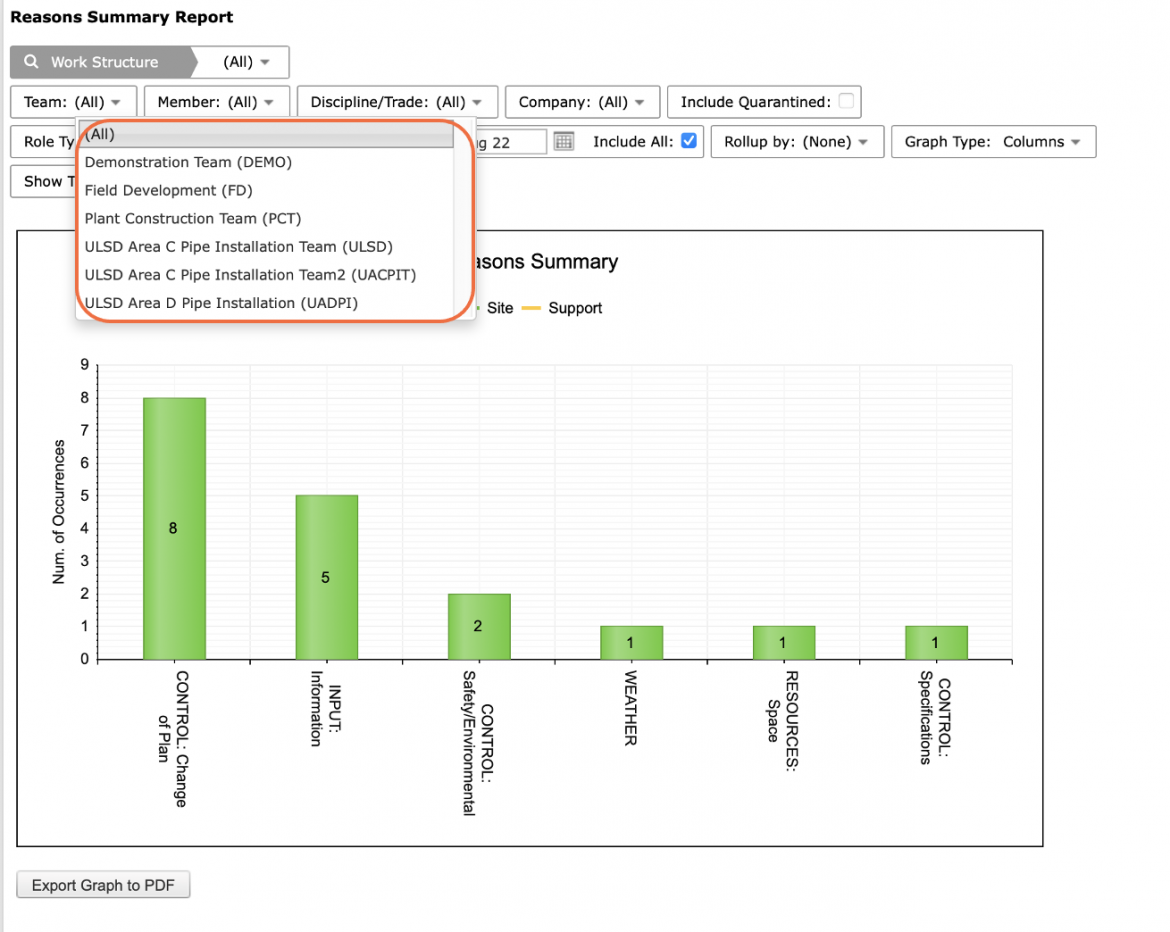
- To view Reasons Summary for another team, select the desired team under the Team drop-down.
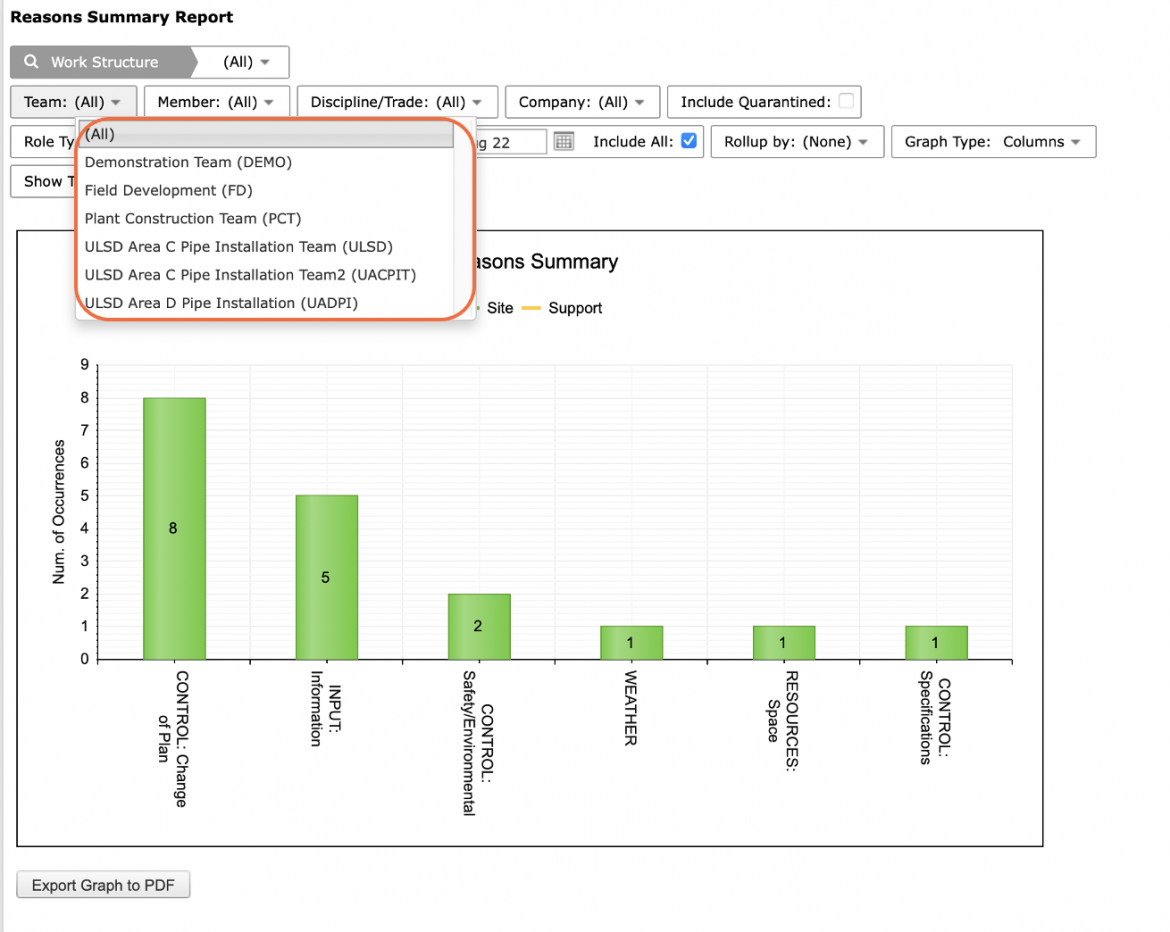
- If a different date range is desired, or no data is visible, adjust the From and To dates or check: Include All, to show all historical data.
The legend elements: Site and Support, are clickable and toggle to display / hide data.
- Also use the Pin icon in the top right of the graph to include Reasons Summary in your Dashboard.
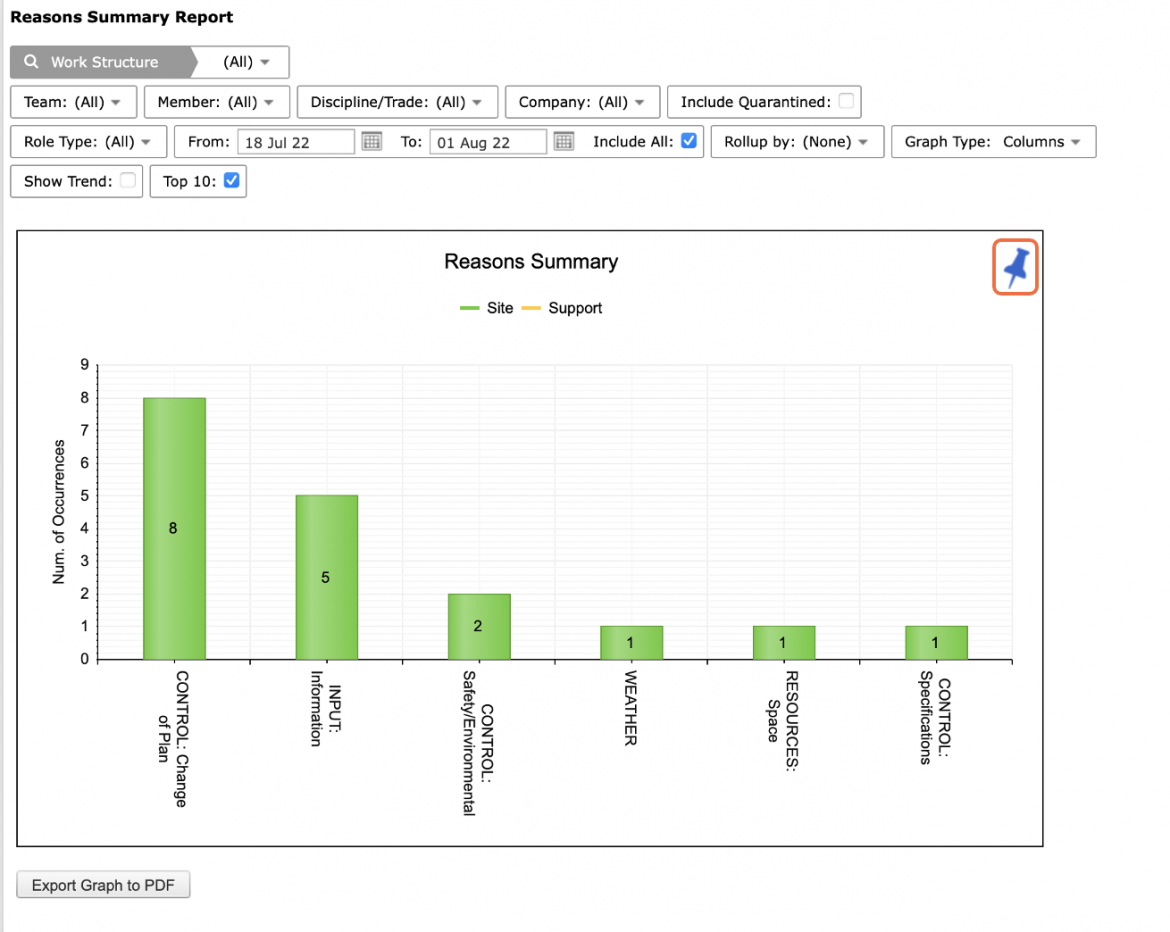
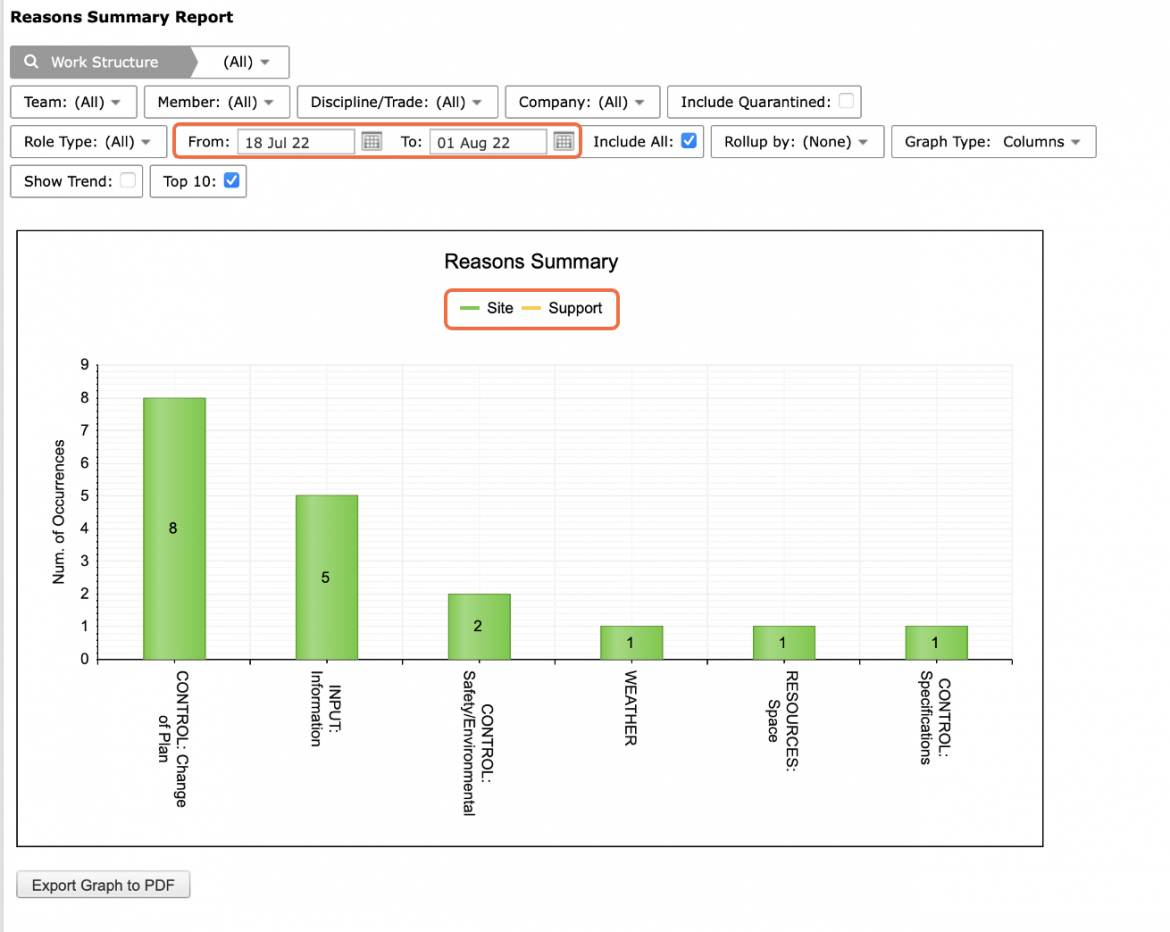
- For the selected team(s), Reasons Summary displays the total number of occurrences for each category (for all past Production Plans) in a column graph, with the actual count shown on each bar.
Improvement efforts can be prioritized for the two or three most important reasons for task non-completion. Do not analyze reasons in isolation, but rather together with Schedule Variance, Commitment Reliability, and Root Cause Analysis. While variability cannot be completely eliminated, project teams should minimize occurrences to the extent optimal.
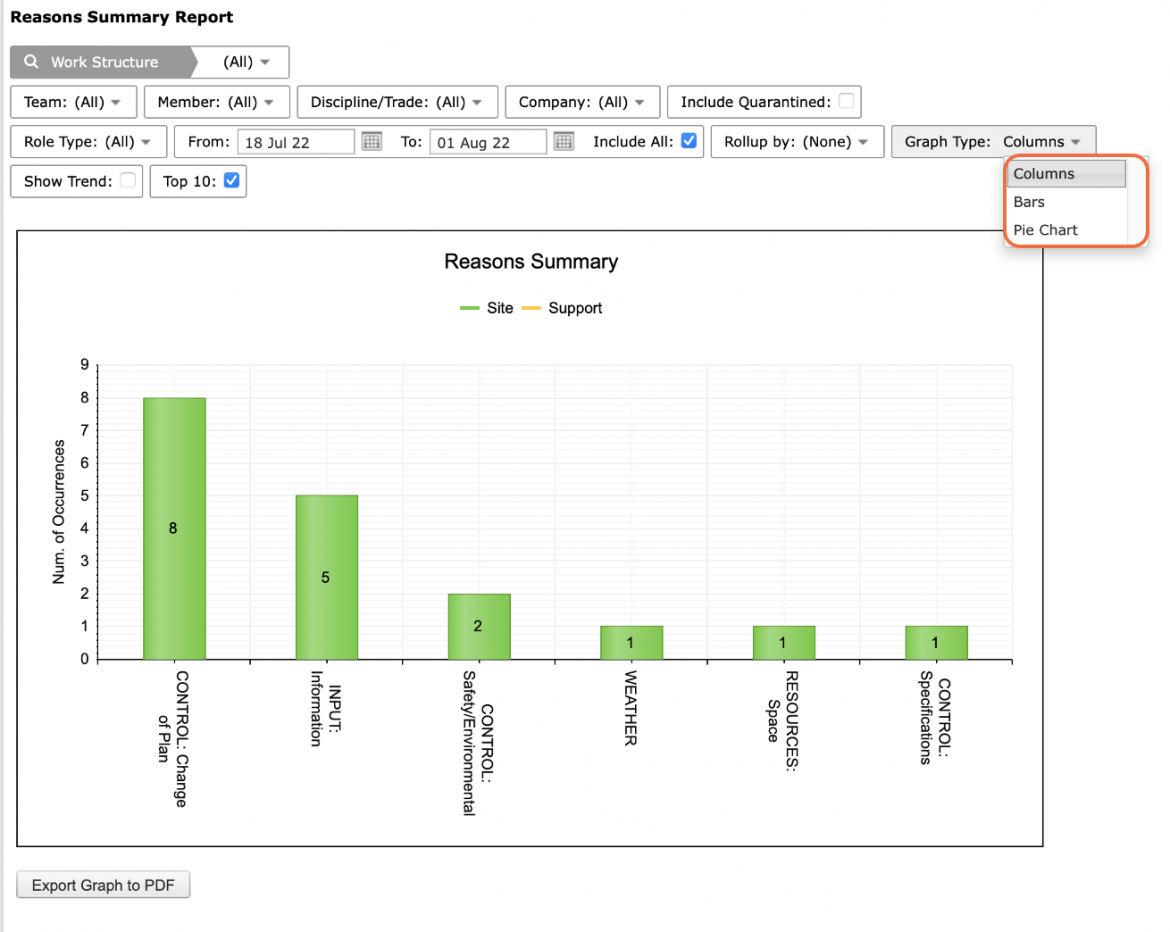
To change the graph layout to bar or pie, select the desired format under: Graph Type.
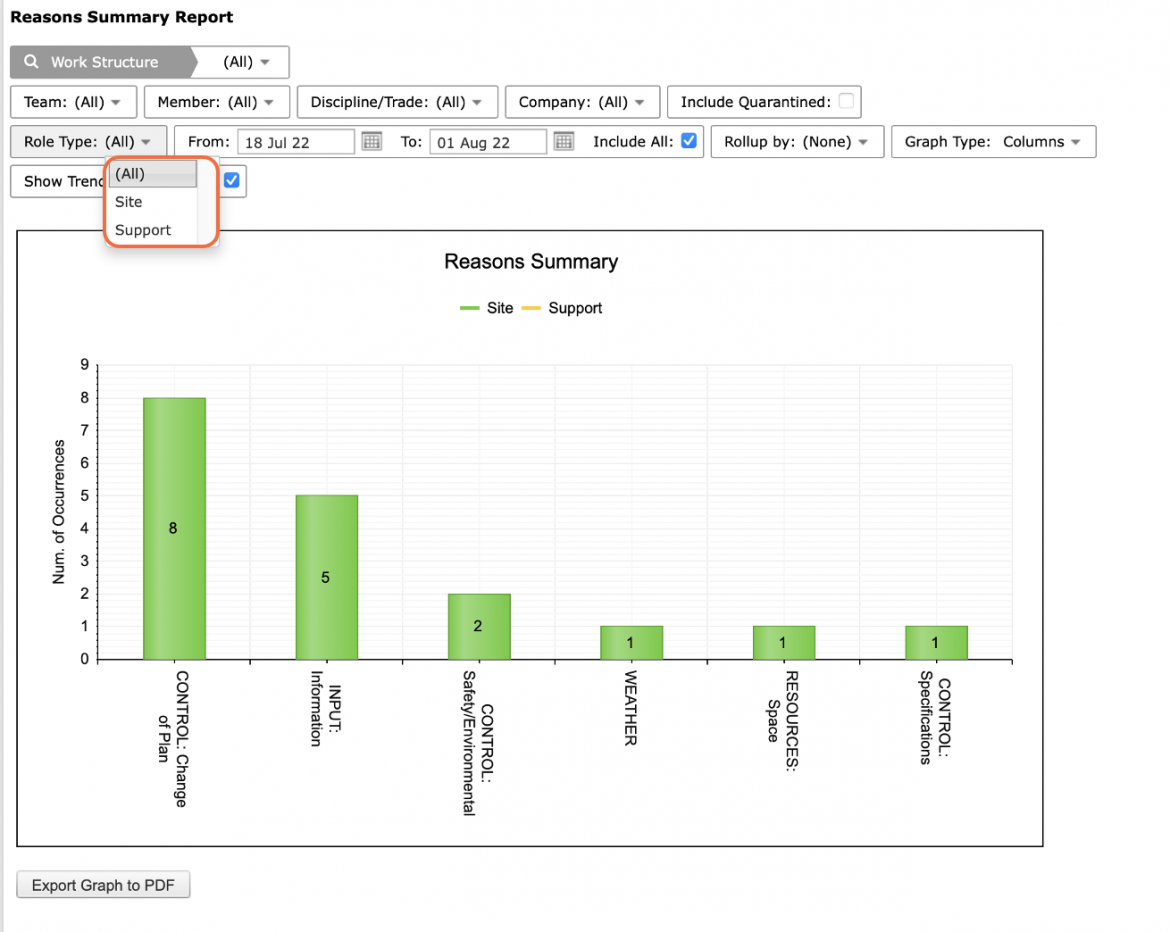
- To view the reasons for Site activities versus or Support i.e., Non-Site, activities, select the desired role under: Role Type or click the desired role in the graph legend.
Reasons Summary automatically sub-categorizes reasons by Site activities (displayed in green) versus Support activities (displayed in yellow).
The distinction between Site activities and Support activities is driven by each team member’s assigned role. For more information on roles, see Add New Member to Team / Create New User Account within Team Management. All activities belonging to a team member with a role classified either as Site or Support will factor into the reliability for the Site or Support category, respectively. Therefore, the accuracy of the data on the Reasons Summary analytic is dependent on how well team members maintain their role information. For information on how to modify or enter role information, see Edit User Preferences within Personalization.
- In addition to viewing Reasons Summary for a single team, to view an aggregate Reasons Summary for all teams select: All, under the Team drop-down.
This feature totals the number of task non-completions for each category for all teams to show global Root Cause issues across the project.
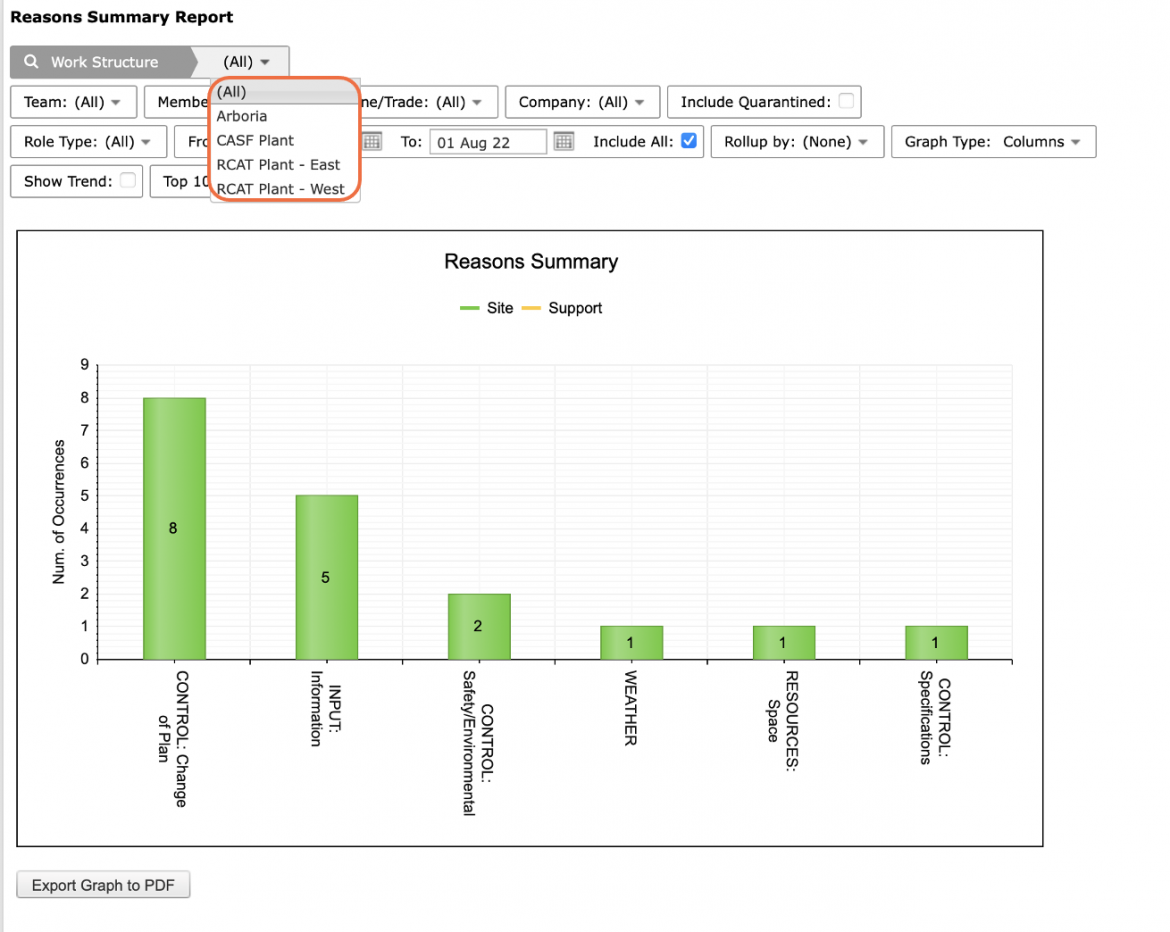
- You can also filter by Member, Company, Discipline / Trade, and Work Structure.
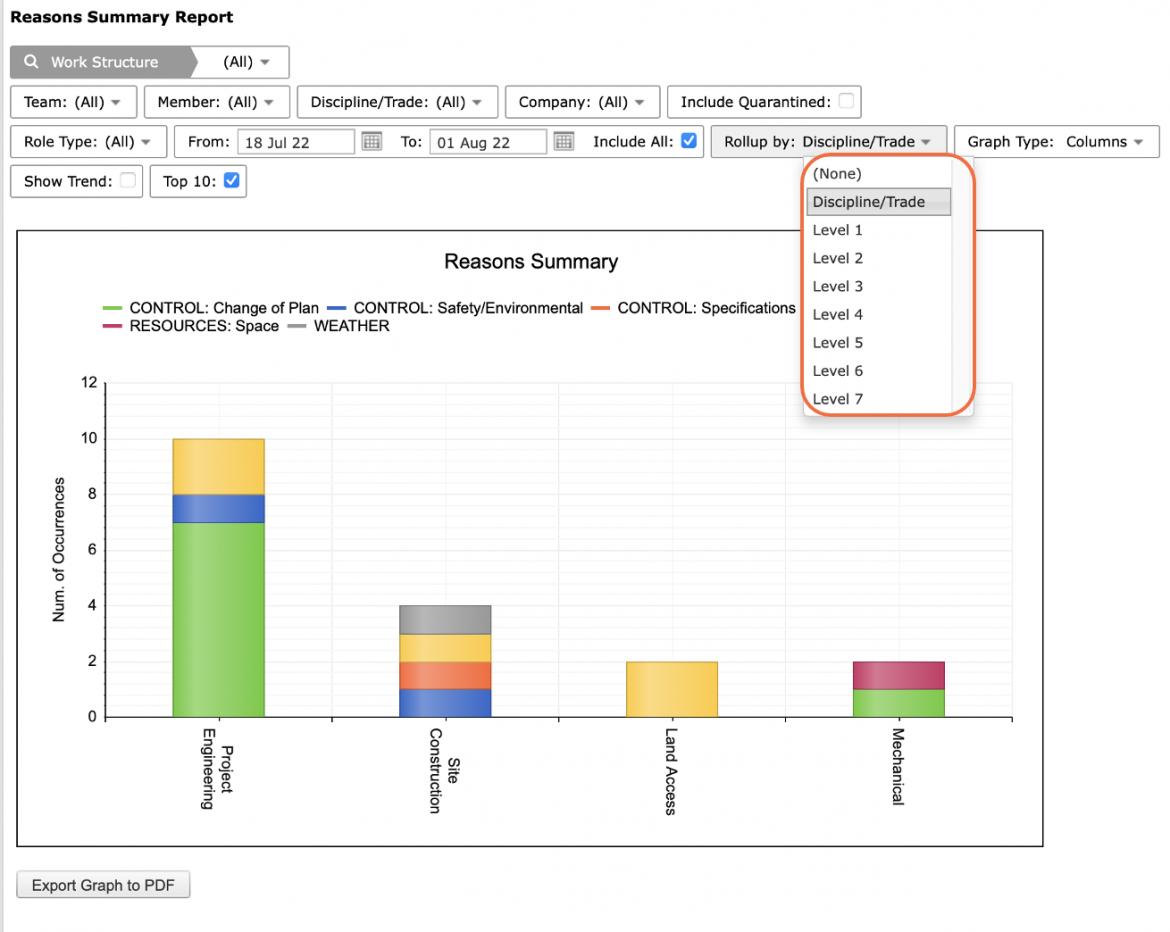
- Reasons Summary can also be rolled up to allow you to view reasons categorized by each Discipline / Trade by clicking Rollup by Discipline / Trade.
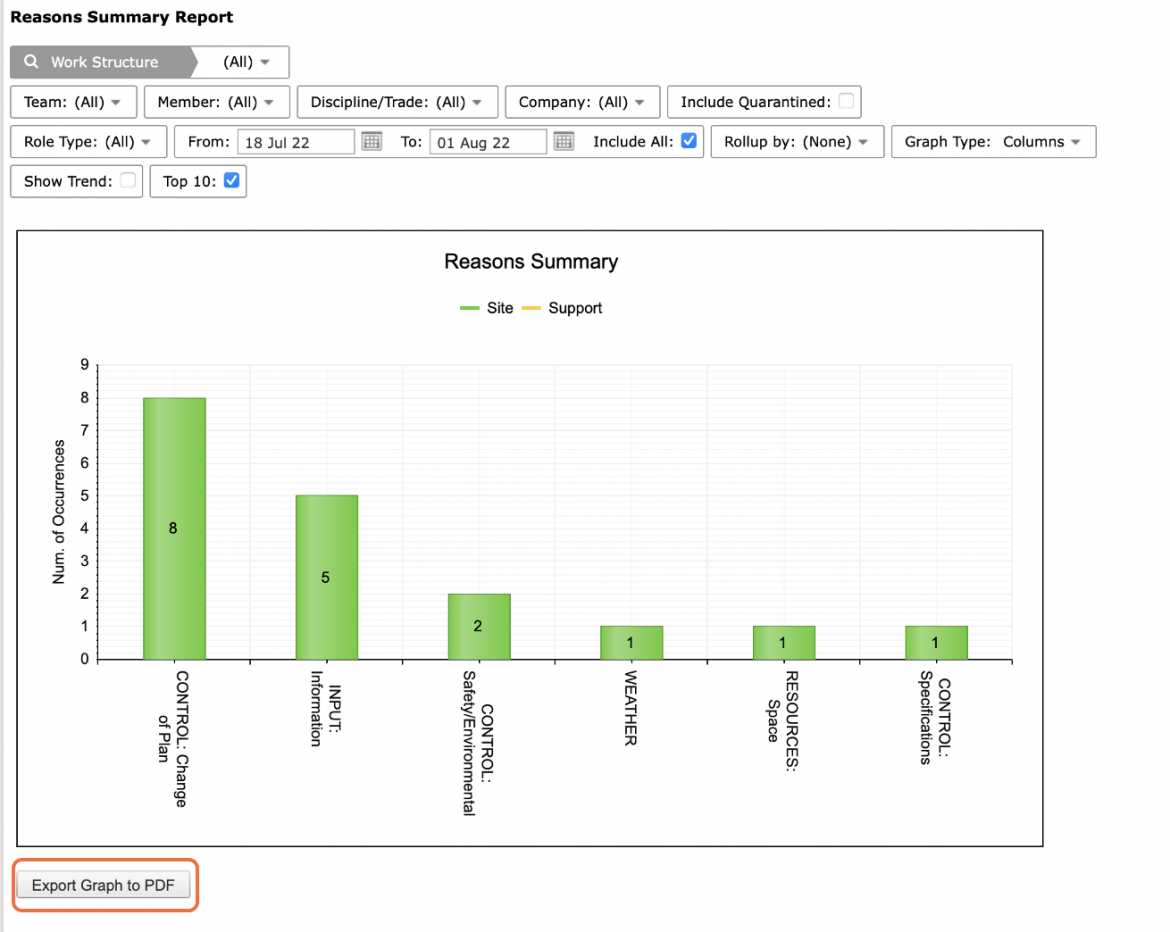
- To export Reasons Summary to a PDF file, click the Export Graph to PDF button and follow the prompts according to the specific browser you are using.
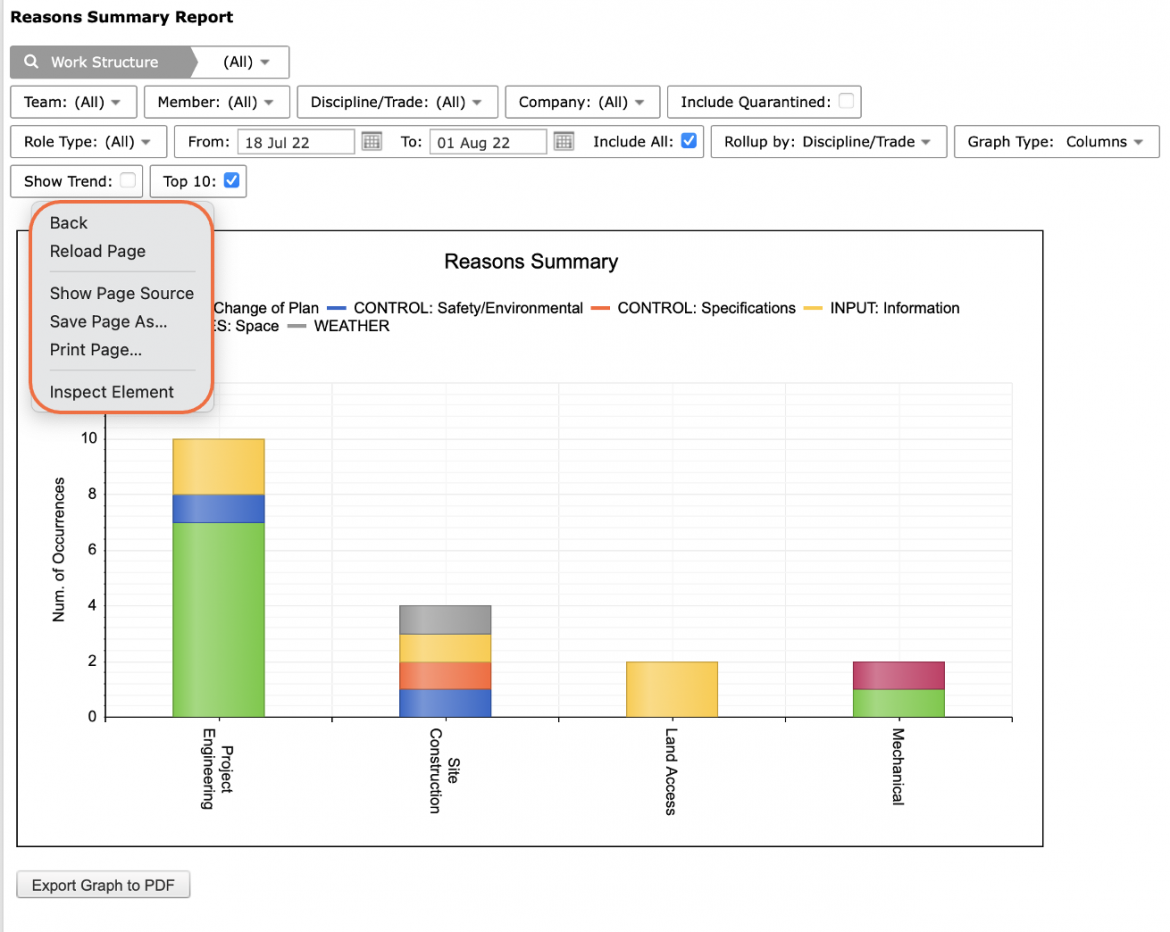
- To print Reasons Summary, options may differ based on your browser. For instance, if you are using Internet Explorer, right-click in the white space outside of the Reasons Summary graph and select Print from the menu or simultaneously press the Ctrl and P keys on your keyboard.
- The Print Dialogue box opens.
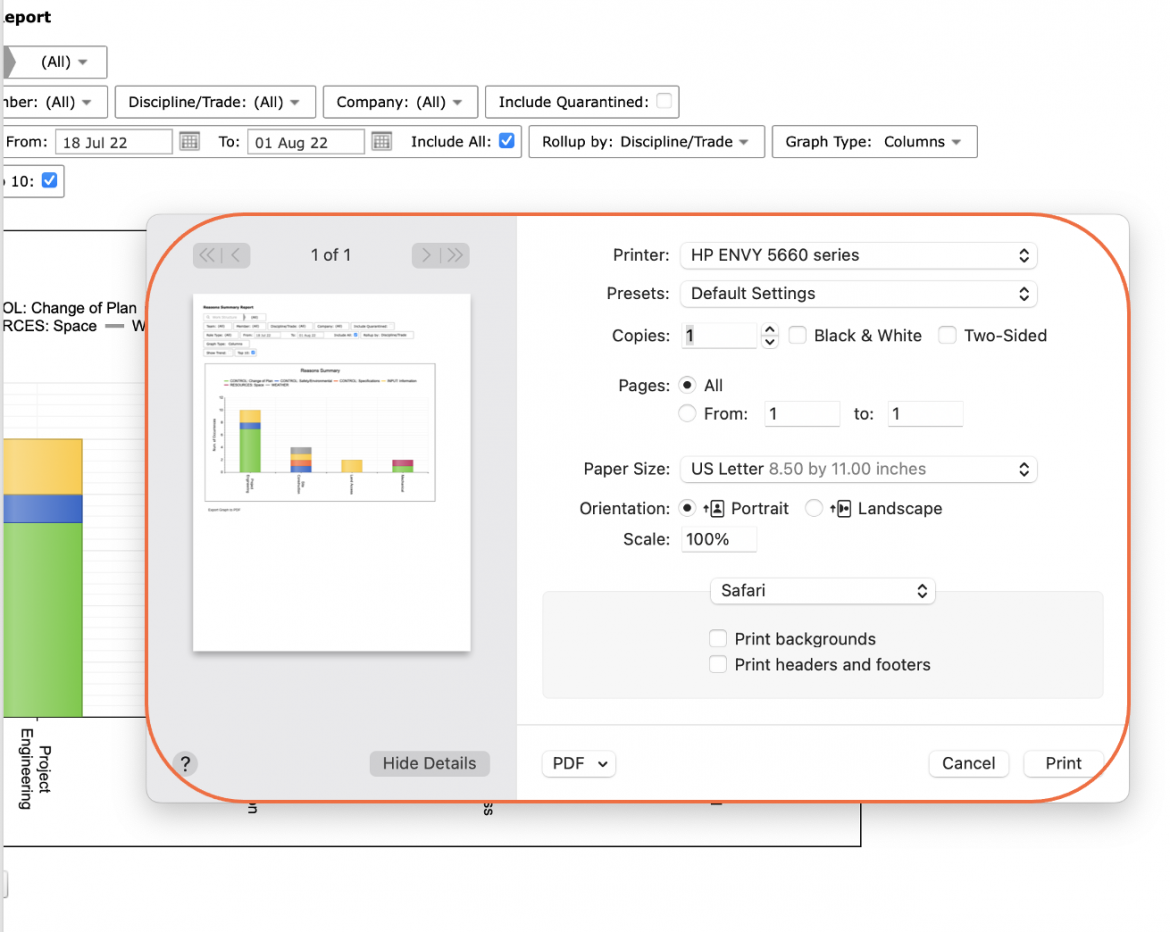
- Once all relevant printing settings have been modified, click the Print button.
Note: Before printing, it is recommended you confirm the fit to the desired paper size.