
To enable the development and optimization of Production Schedules, access to alternative ways of visualizing project production flows is required. Given that individual visualization preferences may vary amongst team members, the Gantt Charter report enables visualizing Production Schedules in a Gantt chart format. The Gantt Charter plots the workflow logic and progress of any workstream (or portion of a workstream) and allows for a commitment of work directly from the Gantt Charter through embedded functions.
To access the Gantt Charter view, complete the steps below:
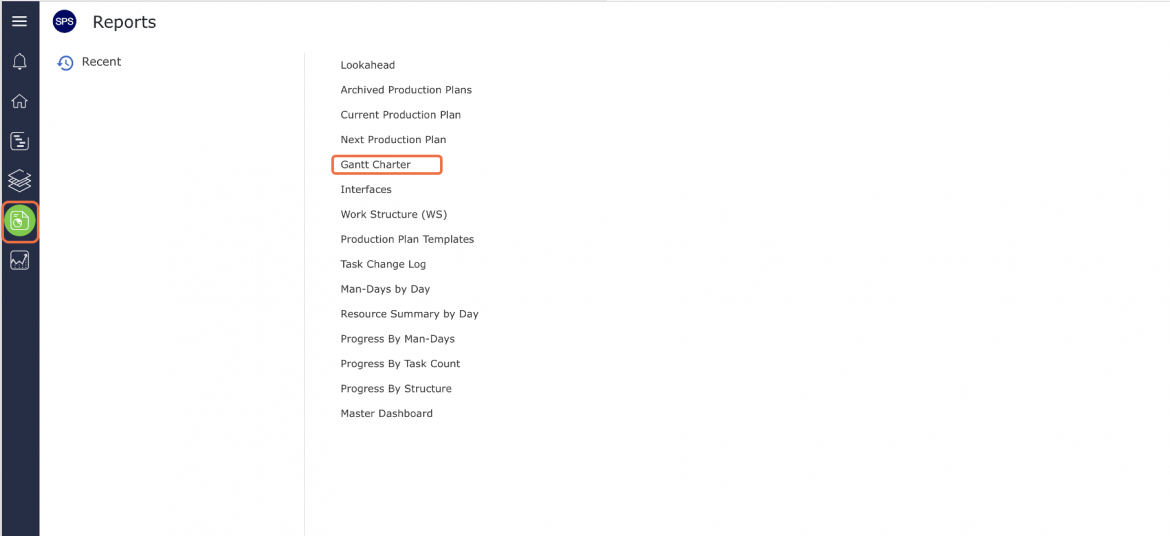
- From the Main Navigation Bar select Reports, and then select Gantt Charter.
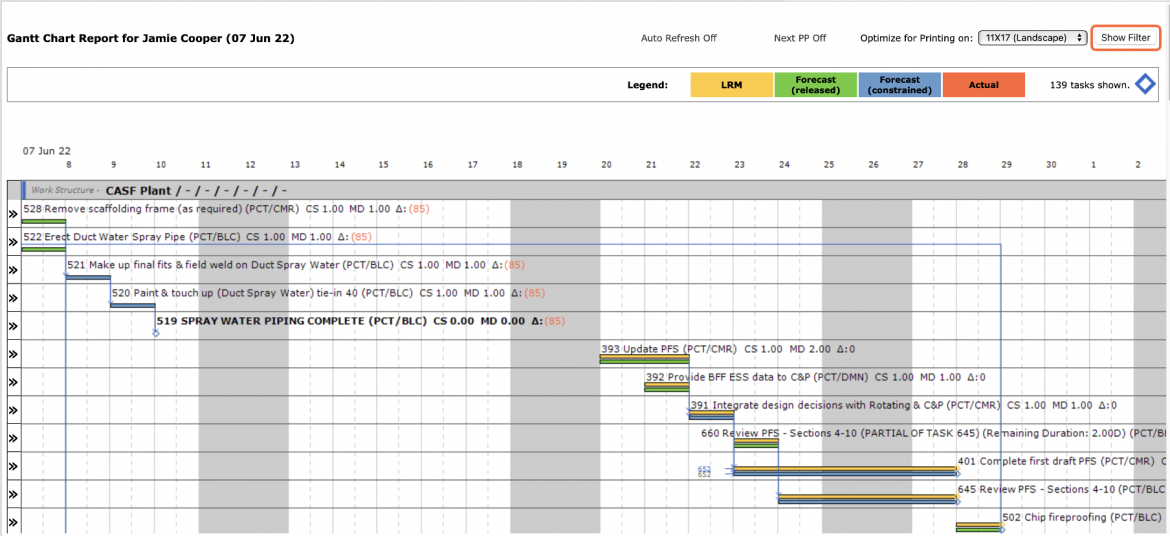
- The Gantt Charter view opens in a new window and automatically displays the report for the team selected under the Team Menu. Click the Show / Hide Filter button to display or hide the filters above the report.
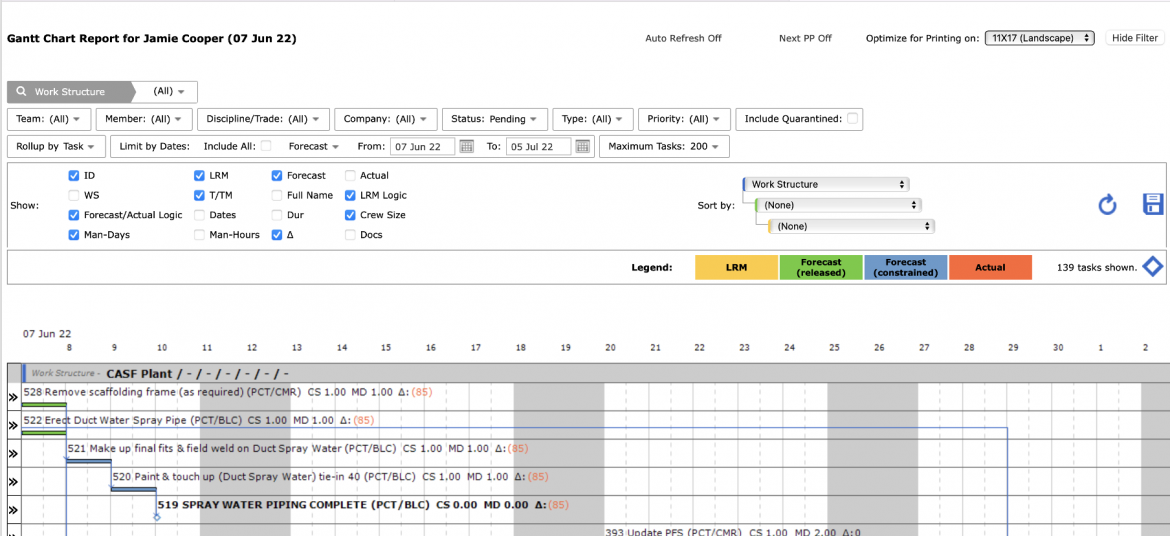
- The LRM, Forecast, and Actual dates are plotted for all tasks in the workstream, but each set of dates can be hidden using the deselecting attributes within Show. Note that the “Actual” bar will only appear on the chart if the task has been completed.
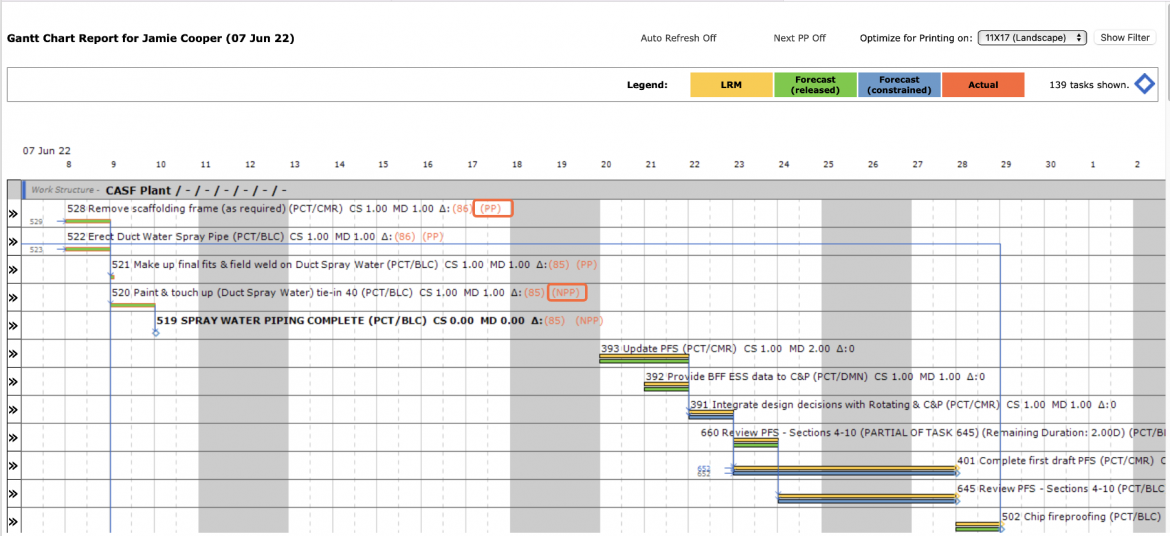
- Gray arrows connecting the bars denote linkages between tasks in the workstream, and any linked tasks not plotted on the chart are represented by their Task ID’s. Any task, which is on the Current Production Plan, will be outlined in red and appended with “(PP)” after the task description and any other displayed attributes. Likewise, tasks on the Next Production Plan will be appended with “(NPP).”
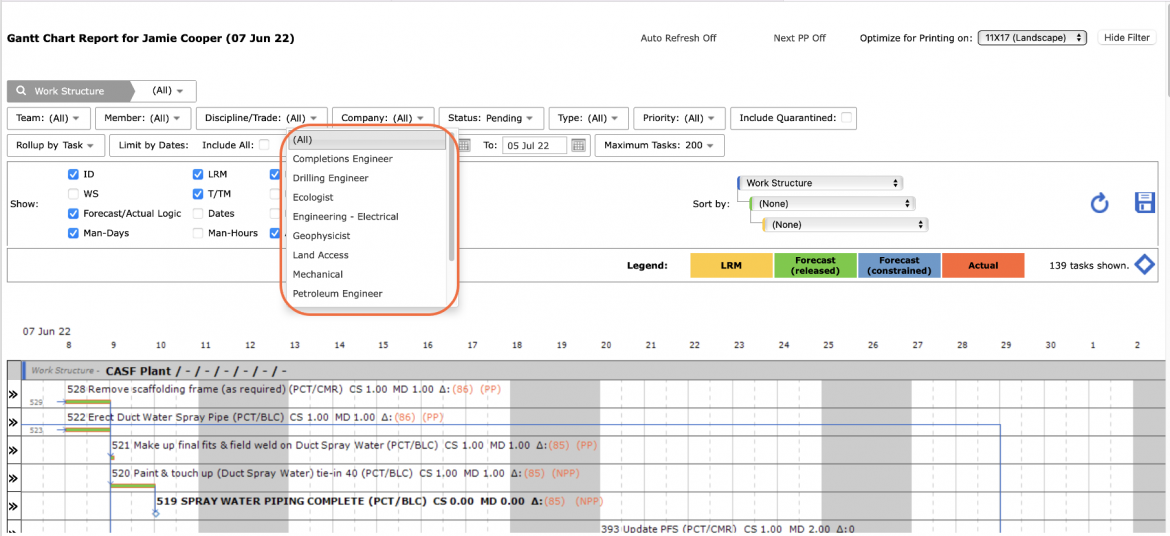
- The work streams shown on the report can be limited by filtering by task dates (LRM, Forecast, or Actual), Work Structure, team, team member, Discipline / Trade, company, and task status.
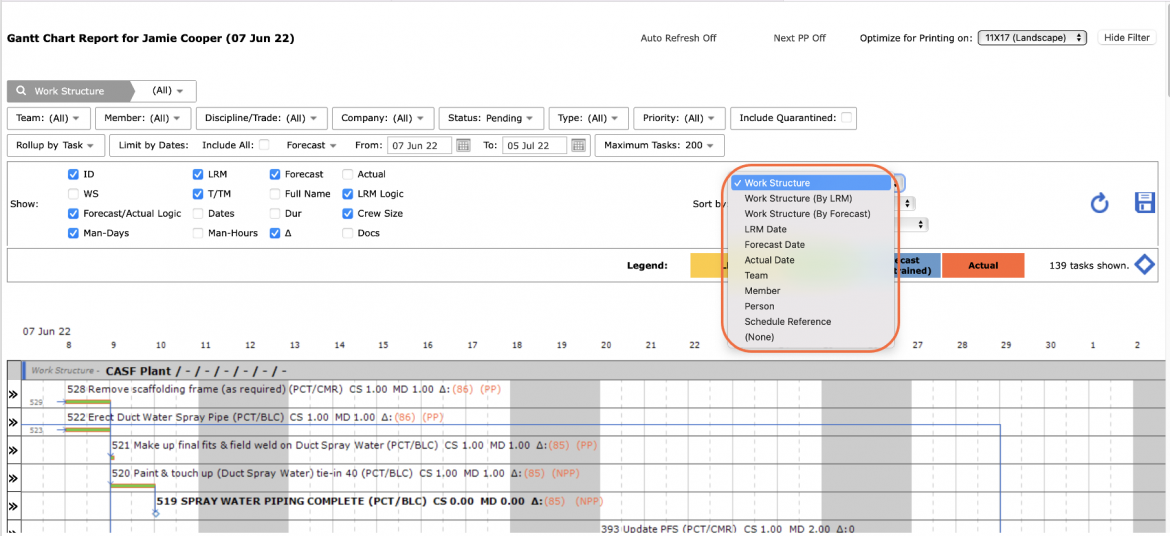
- Sort the data by selecting a value under the Sort by drop-down.
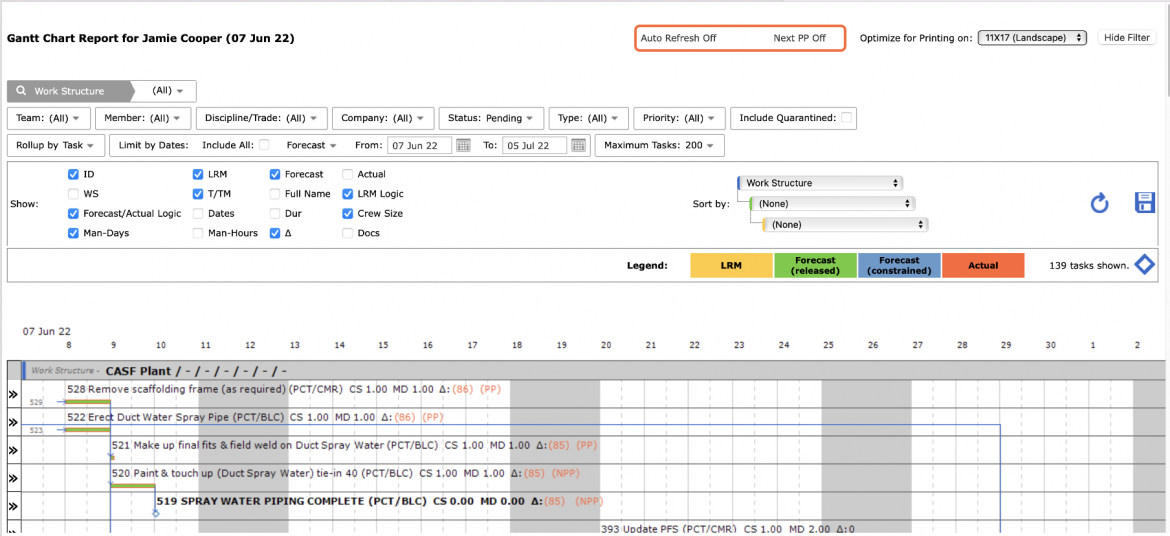
- The Gantt Charter view can be set to automatically refresh and update the information every 30 seconds from the Auto Refresh at the top of the window above the attribute filters. Clicking Auto Refresh again will turn it off. The Next PP link to the right of Auto Refresh will toggle off / on the ability to add tasks to the Next Production Plan from checkboxes to the left of any released tasks.
- For information on managing the Gantt Charter view such as how to insert, edit and delete Milestones / Tasks and constraints and create / delete workflow logic, see Using Gantt Charter.
- Depending on your browser, access to printing options may vary. For example, if you use Internet Explorer, to print the Gantt Charter report, right-click in the white space outside of the Gantt Charter view and select Print from the menu or simultaneously press the Ctrl and P keys on your keyboard.
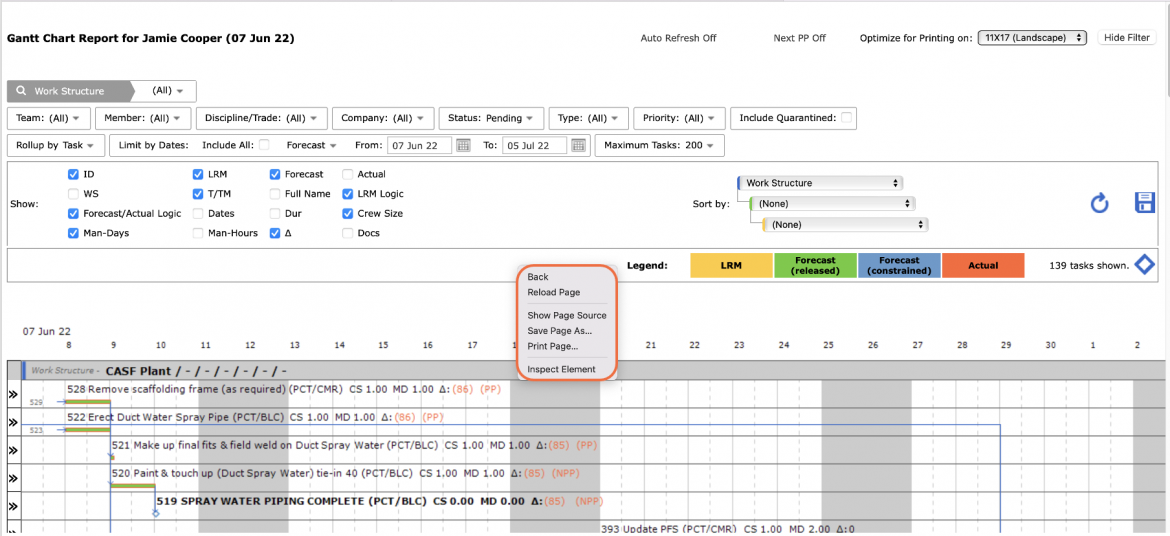
- The Print Dialogue box opens.
- Using the Print Dialogue box, change any desired print settings. Once all relevant printing settings have been modified, click the Print button.
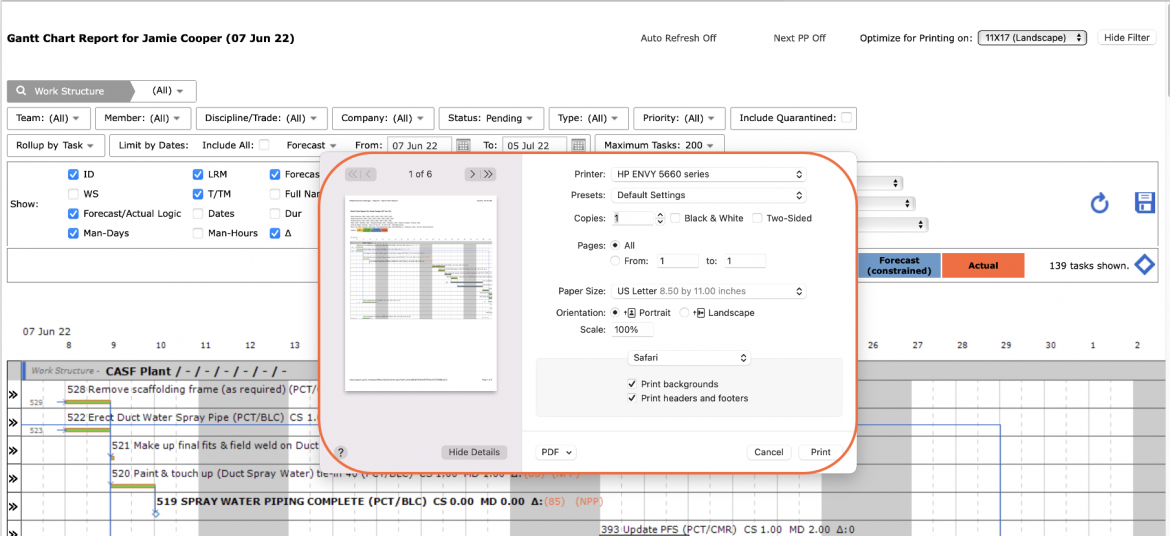
Note: Before printing the report, it is recommended you confirm whether the report fits the desired paper size.