
The ability of a project team to consistently update and create Production Plans with input from all team members has a direct and significant impact on the project team’s ability to coordinate and execute work, as well as to produce data to support Performance Improvement efforts. Consistent Production Planning is critical due to the dependencies among multiple Disciplines / Trades, functions, and/or companies and the release of tasks between them that occurs as work is committed or closed out.
Production Plan Analysis measures how well a team is following the business process of updating and creating Production Plans within the agreed Planning Horizon and enables Production Planning process optimization by exposing teams / members that are not adhering to the process.
To monitor how teams perform Production Planning, Production Plan Analysis uses two indicators: 1) Production Plan Overlap / Gap, and 2) Number of Planned Tasks.
Production Plan Analysis answers the question, “Where are there gaps in committing the Production Plan?” If gaps are identified, the project team should then determine what prevented the team from committing to the Plan. Also, the team should analyze if there are large fluctuations in the number of tasks committed and what was the cause. As part of Performance Improvement, the team should determine what actions need to be taken to prevent the recurrence of gaps and fluctuations in the number of tasks.
To access Production Plan Analysis, complete the steps below:
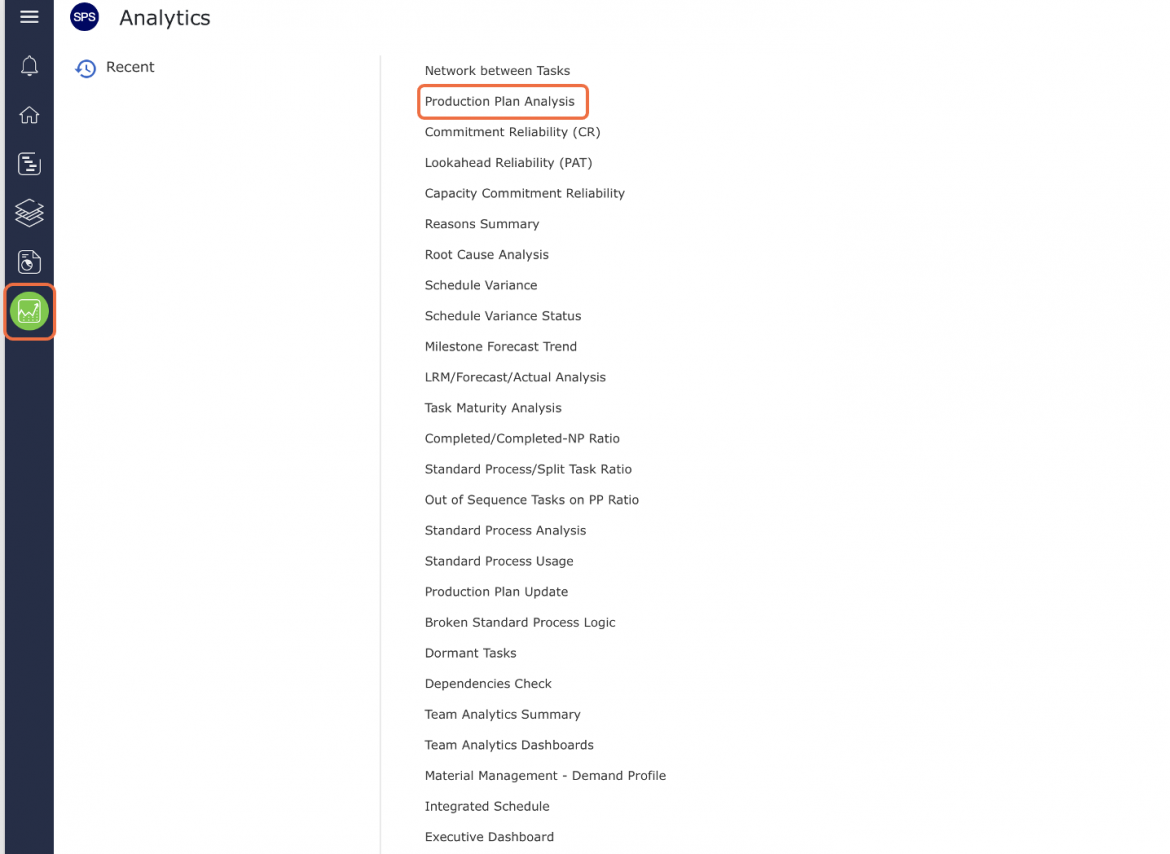
- From the Main Navigation Bar select Analytics, then select Production Plan Analysis.
- Production Plan Analysis opens in a new window and automatically displays the Analytic for the team selected under the Team Menu with the default date range of two weeks from the current date.
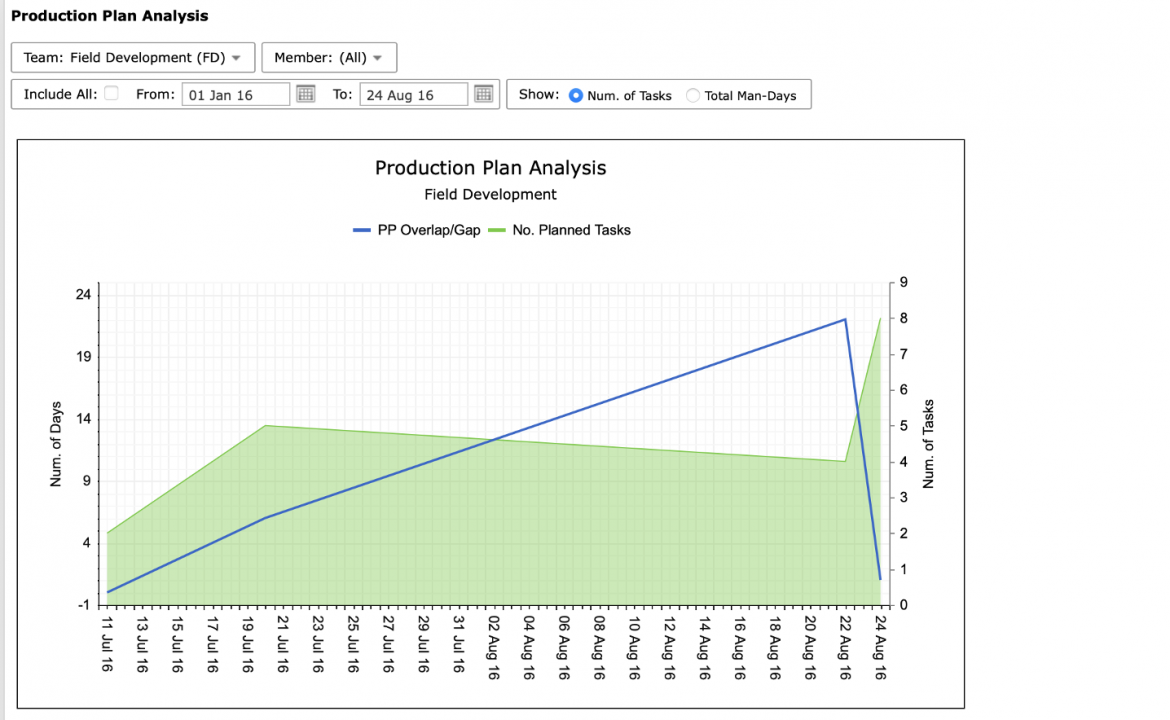
- To view Production Plan Analysis for another team, select the desired team under the Team drop-down.
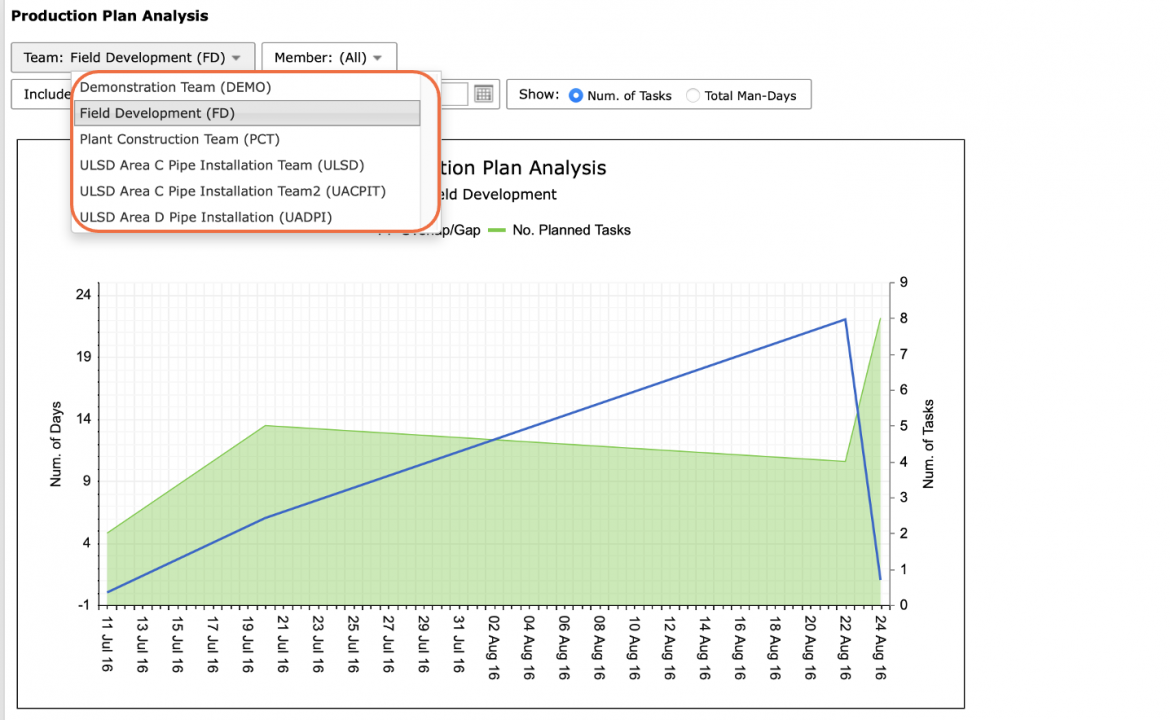
- If a different date range is desired, or no data is visible, adjust the From and To dates, or check Include All to show all historical data.
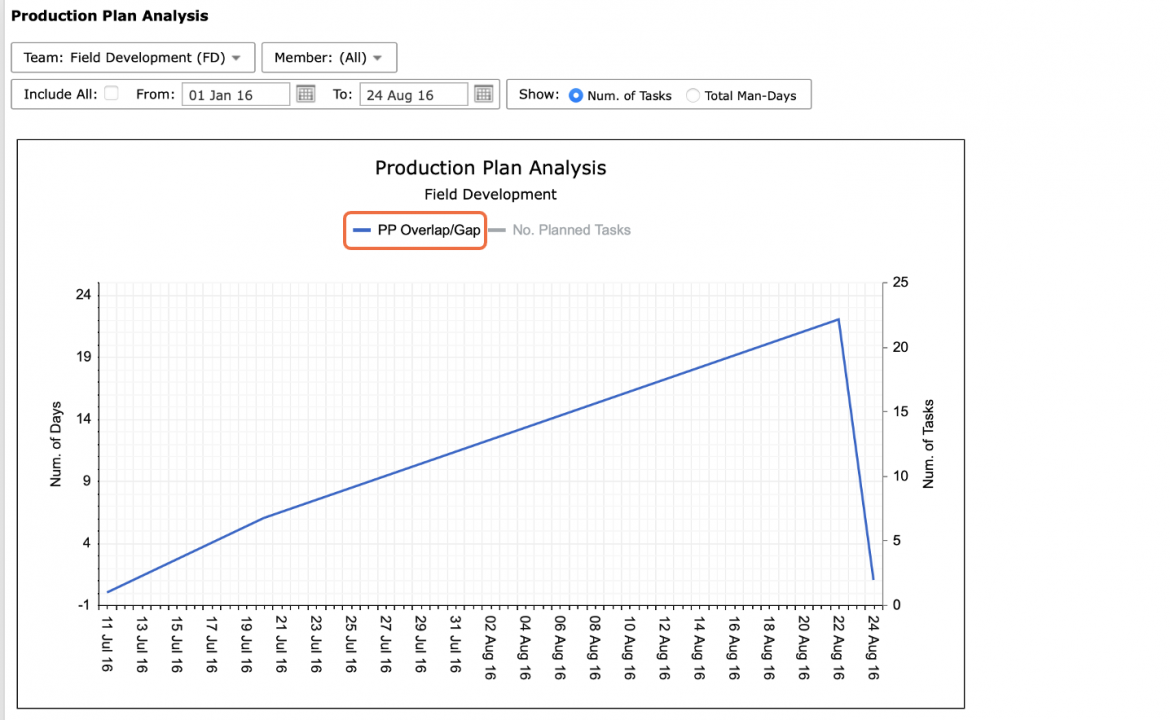
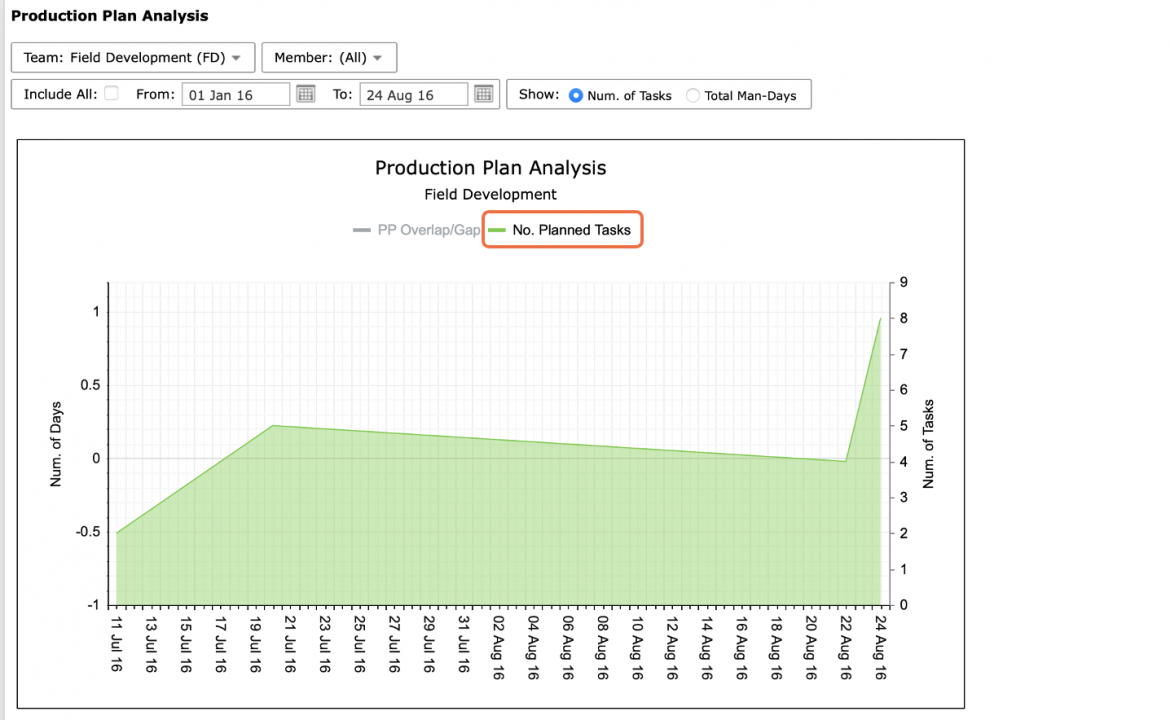
The legend elements, PP Overlap / Gap and No. Planned Tasks, are clickable and toggle to display / hide data.
- Also, use the Pin icon in the top right of the graph to include Production Plan Analysis in your Dashboard.
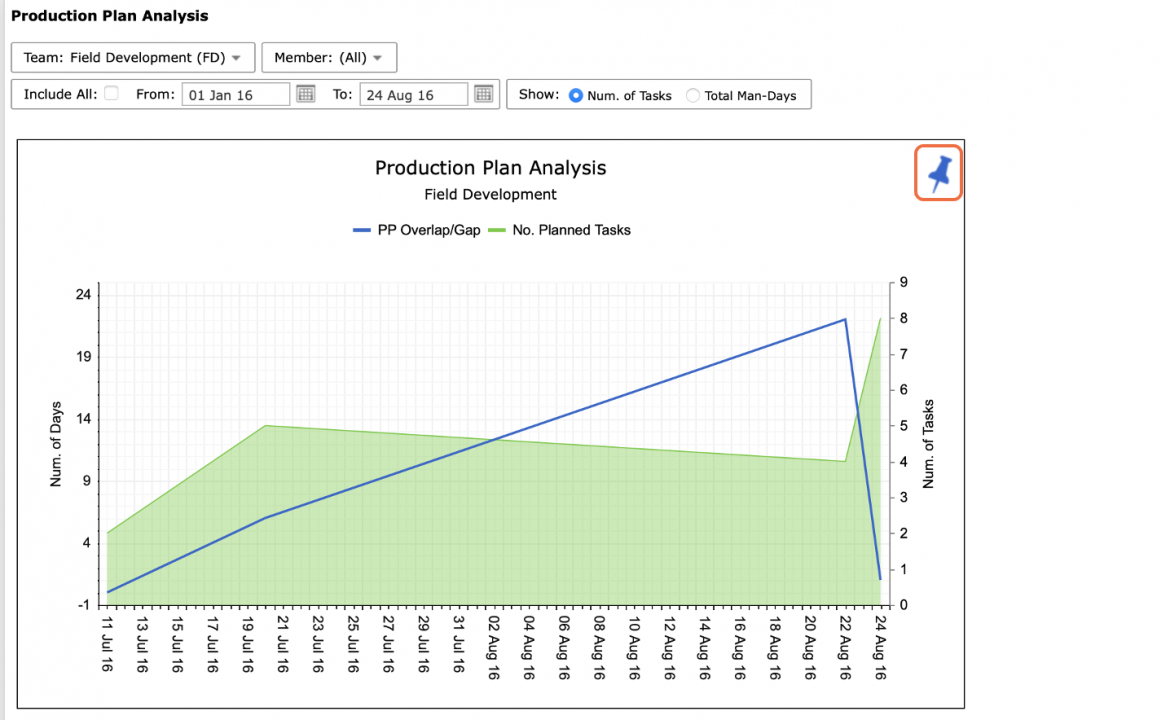
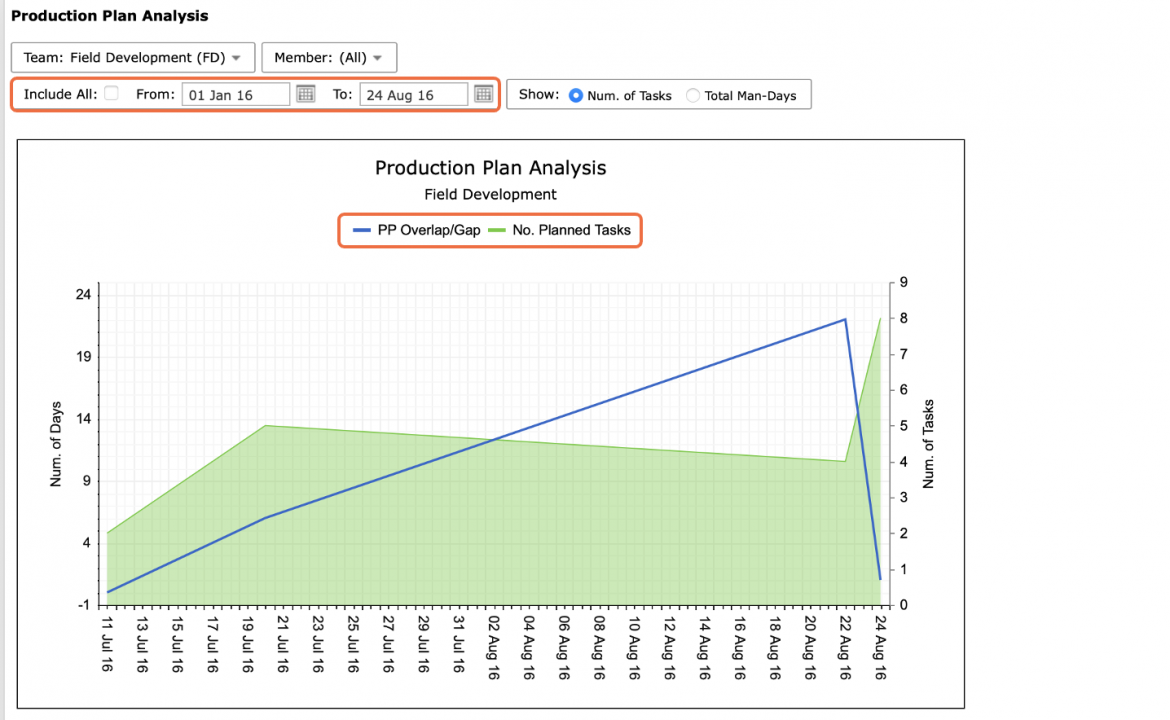
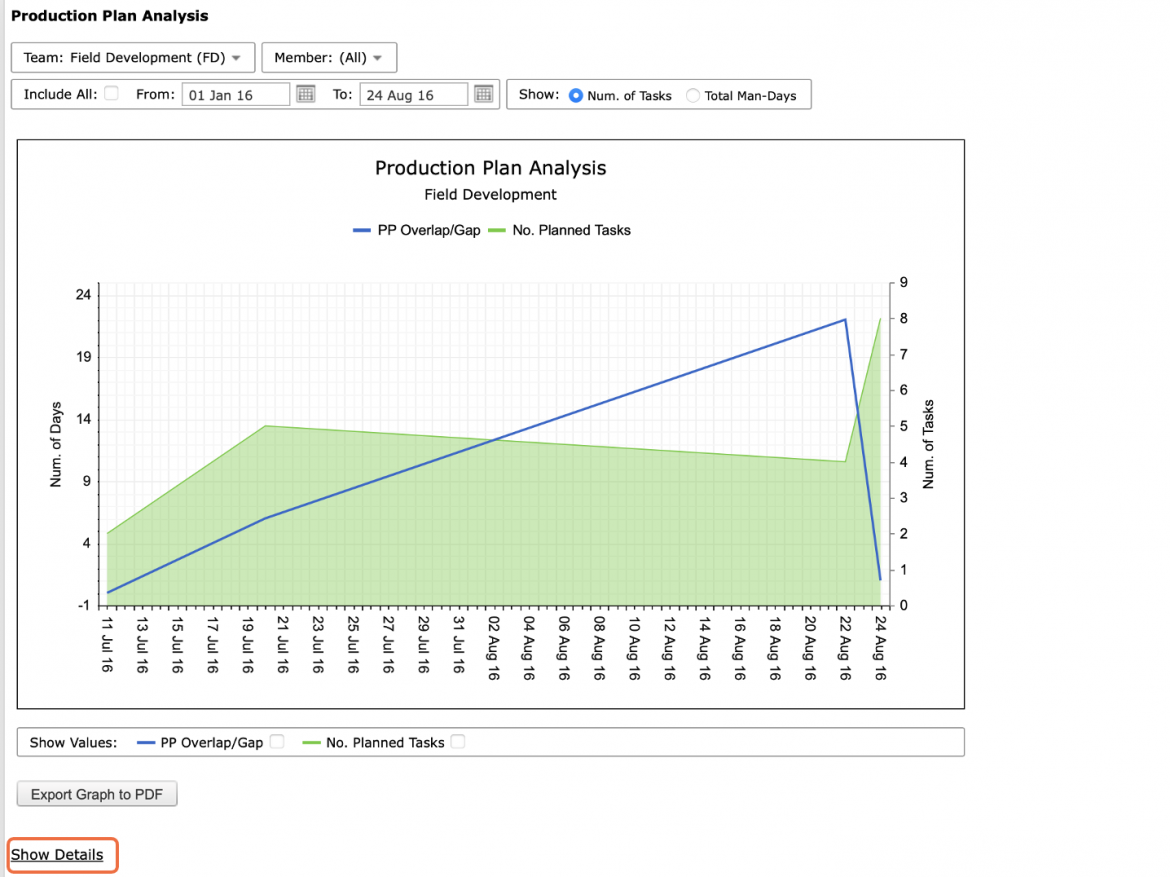
- For the selected team(s), Production Plan Analysis displays the Production Plan Overlap / Gap through a blue line that may fluctuate through positive and negative values over time or simply be flat at zero (optimal).
Production Plan Overlap / Gap indicates how well a team is following the business process of updating and creating Production Plans within the agreed Planning Horizon. The unit of measurement is Num. of Days. For instance, if a team was supposed to create its Production Plan on Thursday, but ended up creating it on Friday, the Production Plan analysis indicates a gap of +1 day. Alternatively, if the Production Plan is created a day earlier on Wednesday, the Production Plan Overlap / Gap indicates an overlap of -1 day.
The target overlap / gap is zero i.e., blue line at zero at all times.
- For the selected team, Production Plan Analysis also displays No. Planned Tasks through a green shaded region which measures how many tasks were committed on each Production Plan over time independently if the tasks were completed or not completed as planned.
This Performance Indicator is important because it enables comparison between committed workload through Production Plans and the progress that should occur on the overall project. For instance, if a project is at its peak and there are only two tasks on a Production Plan, then it is an obvious indication that the team is not including all of the work they should be doing on the Production Plan. Although it is typical to see some variation in the number of tasks, it should remain relatively consistent as long as there is a consistent amount of capacity assigned to a team.
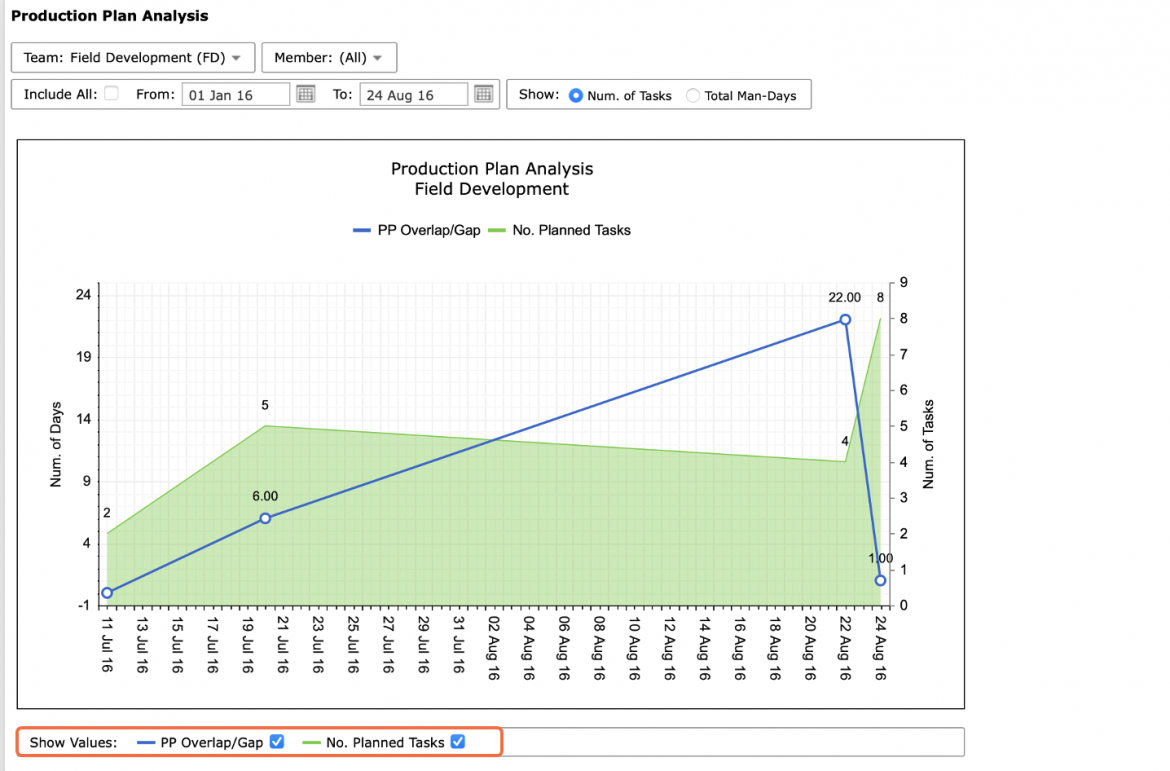
- If desired, the numerical values for all legend elements may be shown in the Production Plan Analysis chart. To display these values, select the checkbox in the ‘Show Values’ section underneath the chart. Note that the legend element must first be activated and displayed in the chart to be able to select the ‘Show Values’ checkbox for that legend element.
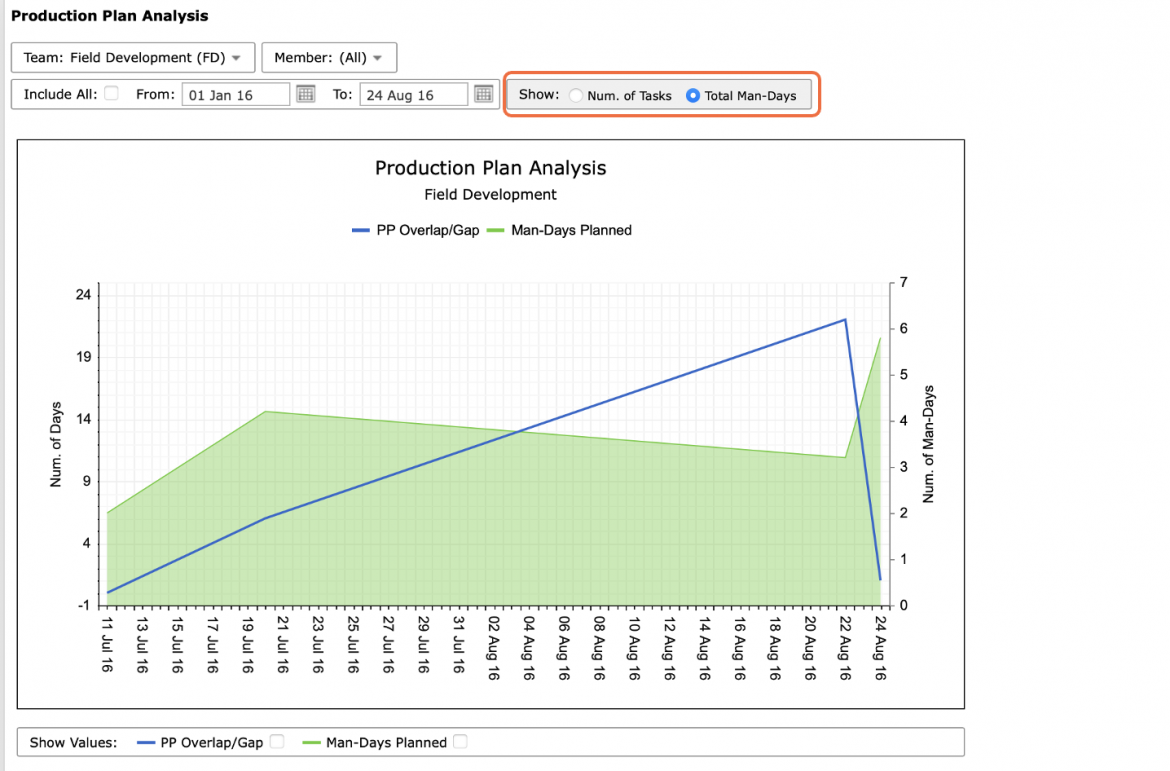
- Planned Tasks can be switched for the total number of Man-Days by clicking the option under Show: Total Man-Days. The legend and the left vertical axis will automatically change to reflect Man-Days.
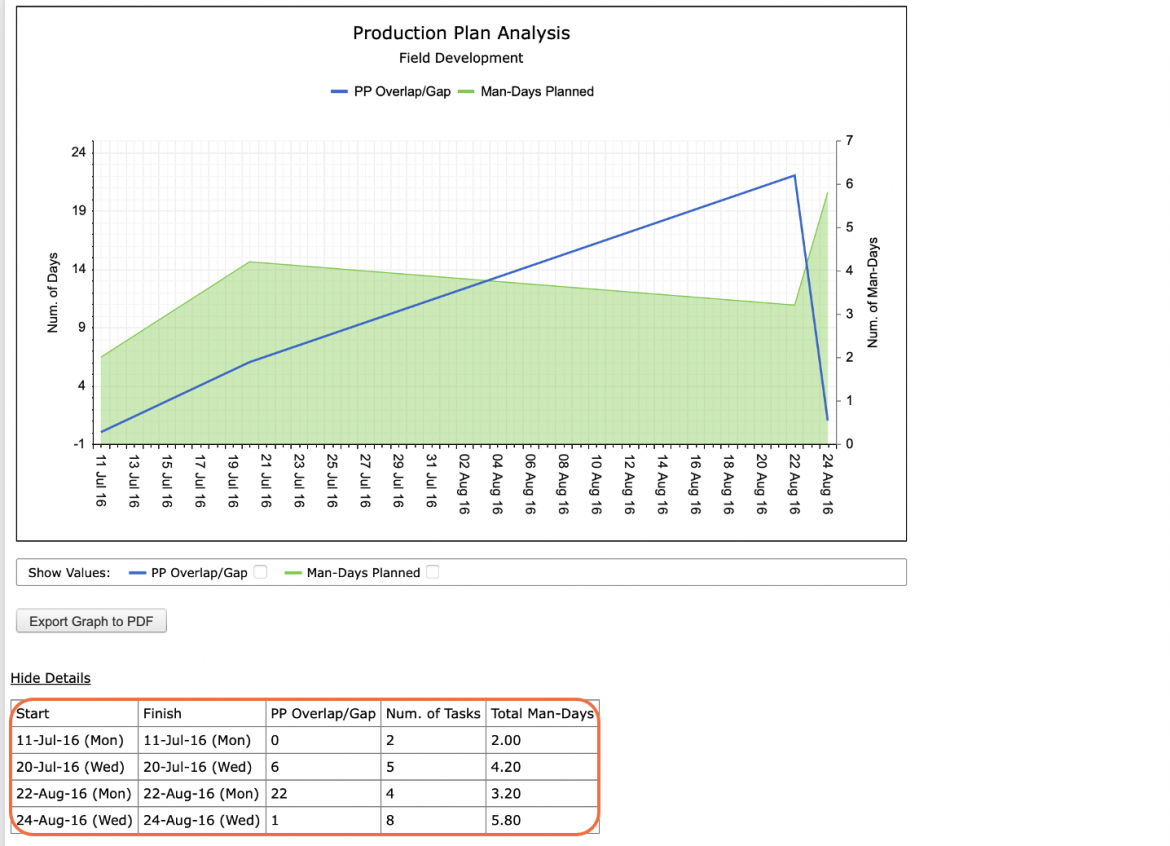
- To view the data behind the Production Plan Analysis calculation for each Production Plan, click Show Details beneath the graph. To hide the data, click Hide Details.
For each Production Plan, the data table lists the start date and end date of the Plan, PP Overlap / Gap values, total number of tasks loaded on the Plan, and associated number of Man-Days.
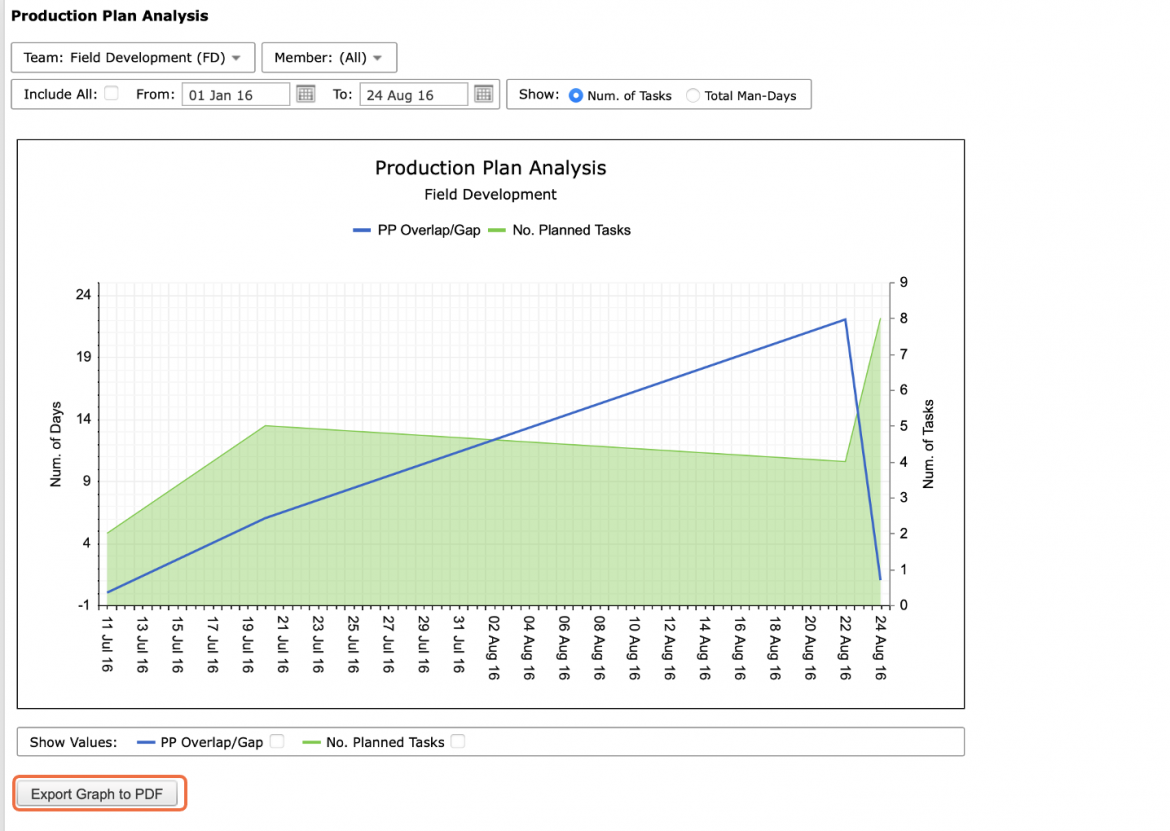
- To export Production Plan Analysis to a PDF file, click the Export Graph to PDF button and follow the prompts according to the specific browser you are using.
- To print Production Plan Analysis, options may differ based on your browser. For instance, if you are using Internet Explorer, right-click in the white space outside of the Production Plan Analysis graph and select Print from the menu or simultaneously press the Ctrl and P keys on your keyboard.
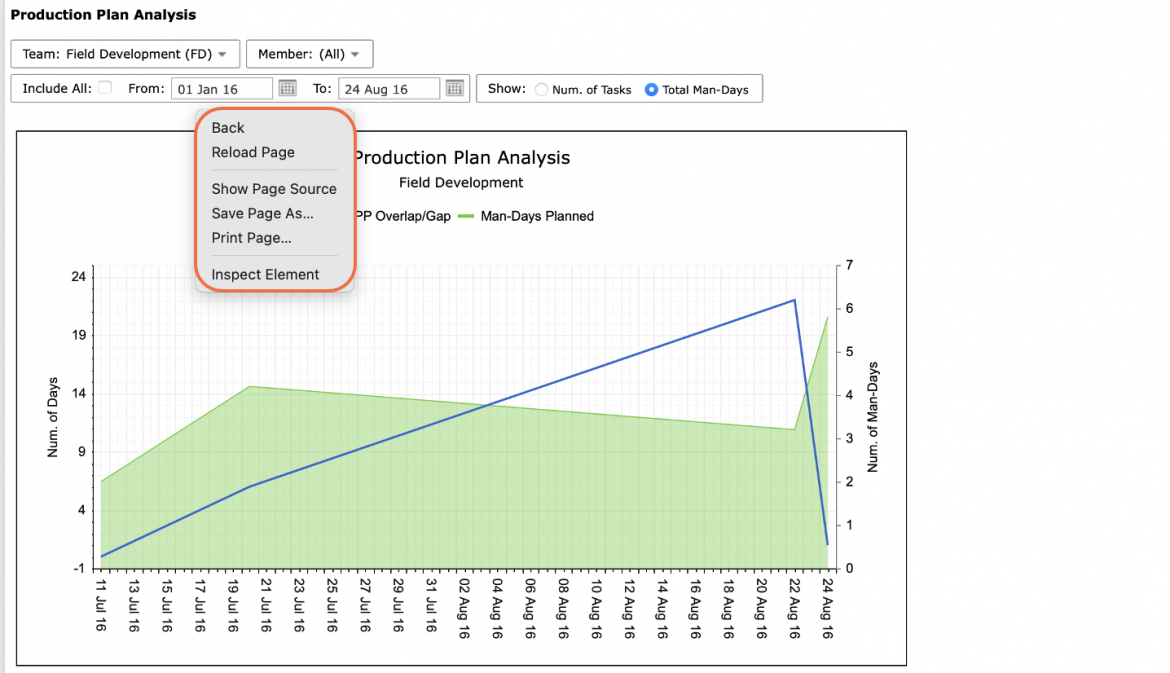
- The Print Dialogue box opens.
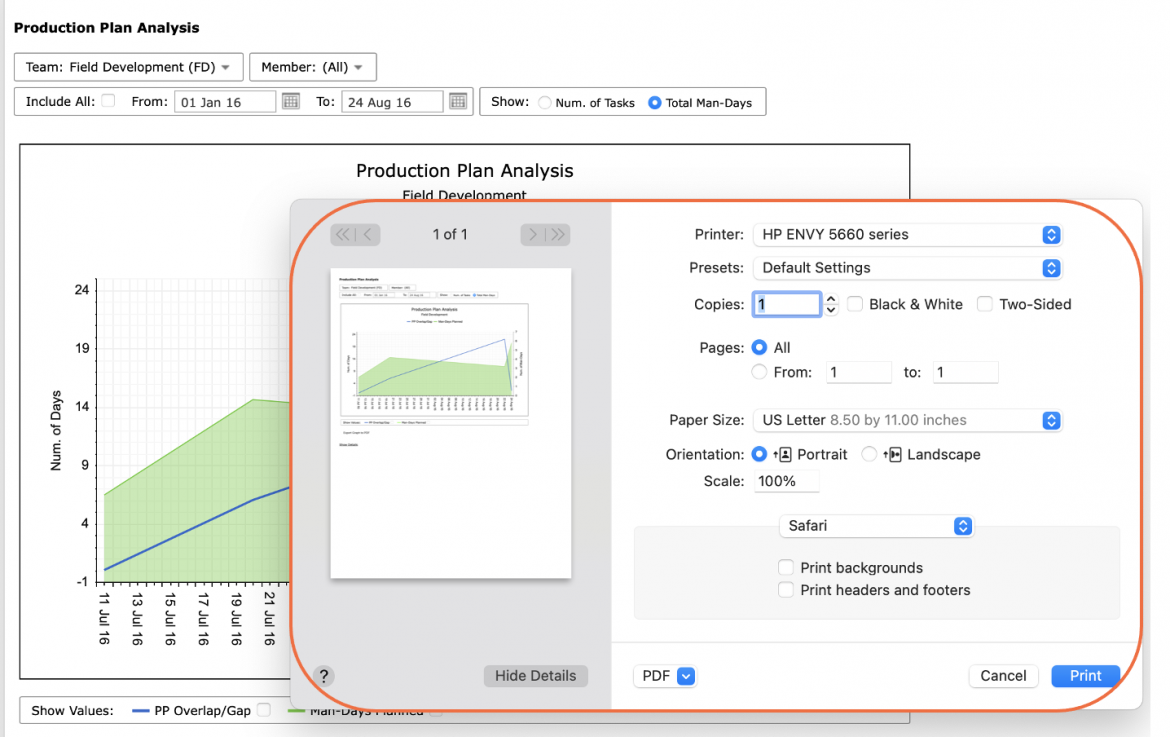
- Using the Print Dialogue box, change any desired print settings. Once all relevant printing settings have been modified, click the Print button. Note: Before printing, it is recommended you confirm the fit to the desired paper size.
Note: Before printing, it is recommended you confirm the fit to the desired paper size.