
Understanding how project production is being planned is essential to ensuring all deliverables (e.g., Milestones) are effectively completed according to project objectives and to alert you in advance to potential production issues.
Task Maturity Analysis does this by measuring the age of Milestones / Tasks in SPS|PM using the number of days as the unit of measurement and calculated based on the following formula:
Task Maturity = Task Committed Date – Task Creation Date
Task Maturity Analysis is an important Performance Indicator because it provides a clear indication of how project production is being planned.
If task maturity results in a low value e.g., 2 days, it means the task was created in SPS|PM two days ago before it was committed on a Production Plan. Higher task maturity values such as weeks e.g., greater than 7 days, indicate that a task has been maintained in the Lookahead for a long period before it was finally completed.
To gauge if Task Maturity Analysis values are optimal or not, they must be evaluated in the context of Production Scheduling rules. For instance, if the agreement is that a team will only manage a 1-week Lookahead in SPS|PM, task maturity values should average 5 – 7 days. Similarly, if the agreement is that a team will only manage 2 – 3 week Lookaheads, task maturity should be expected to be minimally in that same range i.e., 10 – 15 days. A team managing a 4 – 6 week Lookahead, would be expected to have much higher task maturity values of 28 – 36 days.
To access Task Maturity Analysis, complete the steps below:
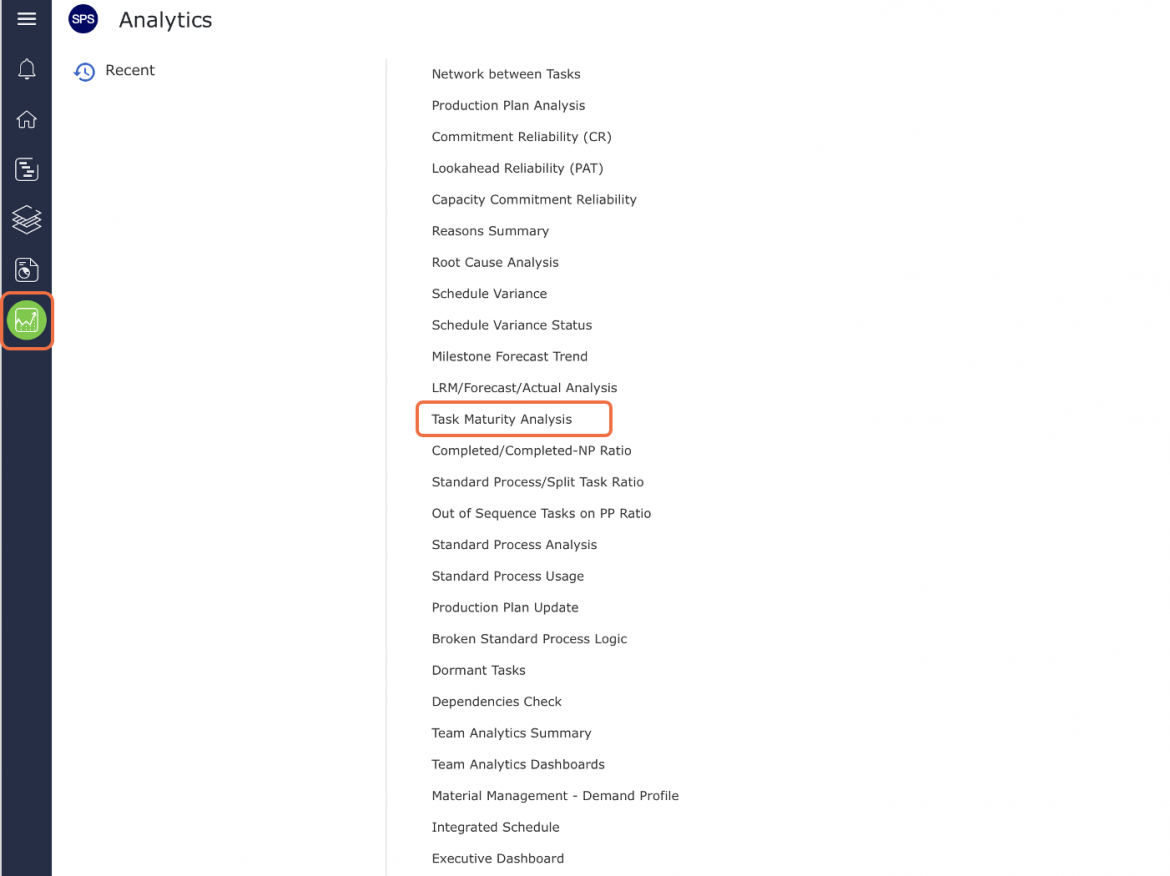
- From the Main Navigation Bar select Analytics, then select Task Maturity Analysis.
- Task Maturity Analysis opens in a new window and automatically displays the Analytic for the team selected under the Team Menu with the default date range of two weeks from the current date.
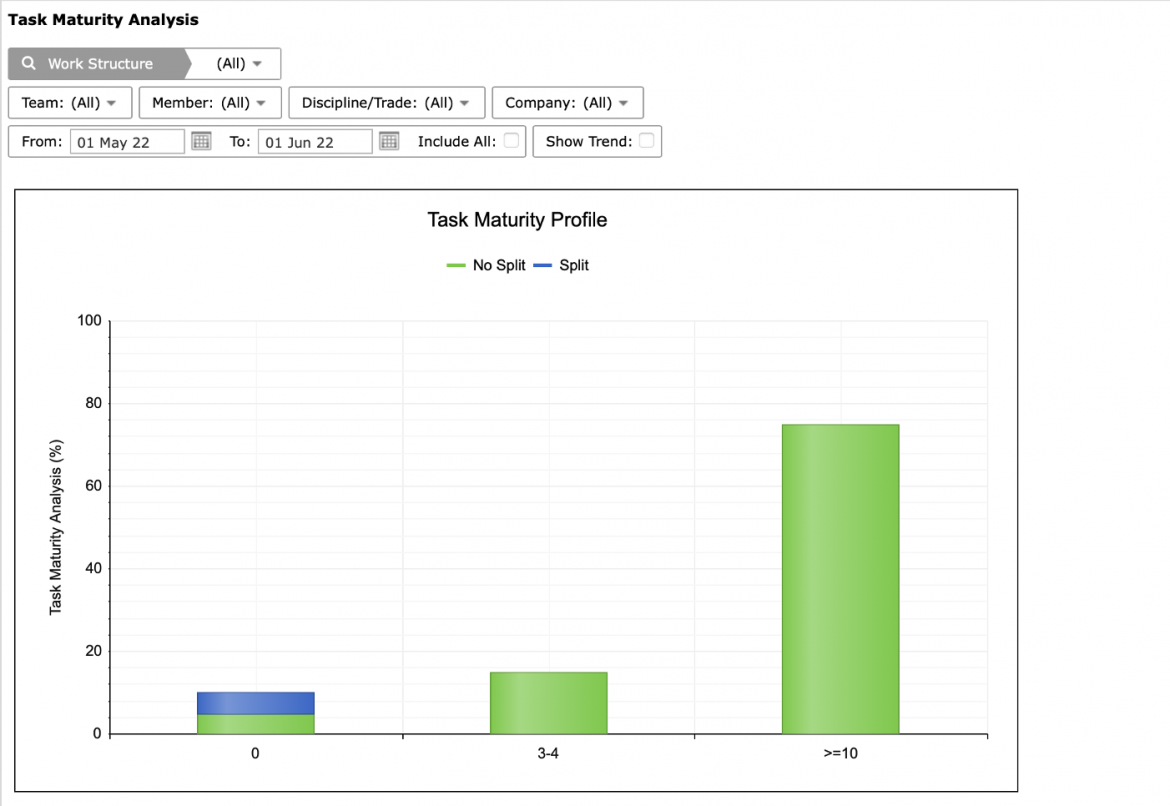
- To view Task Maturity Analysis for another team, select the desired team under the Team drop-down.
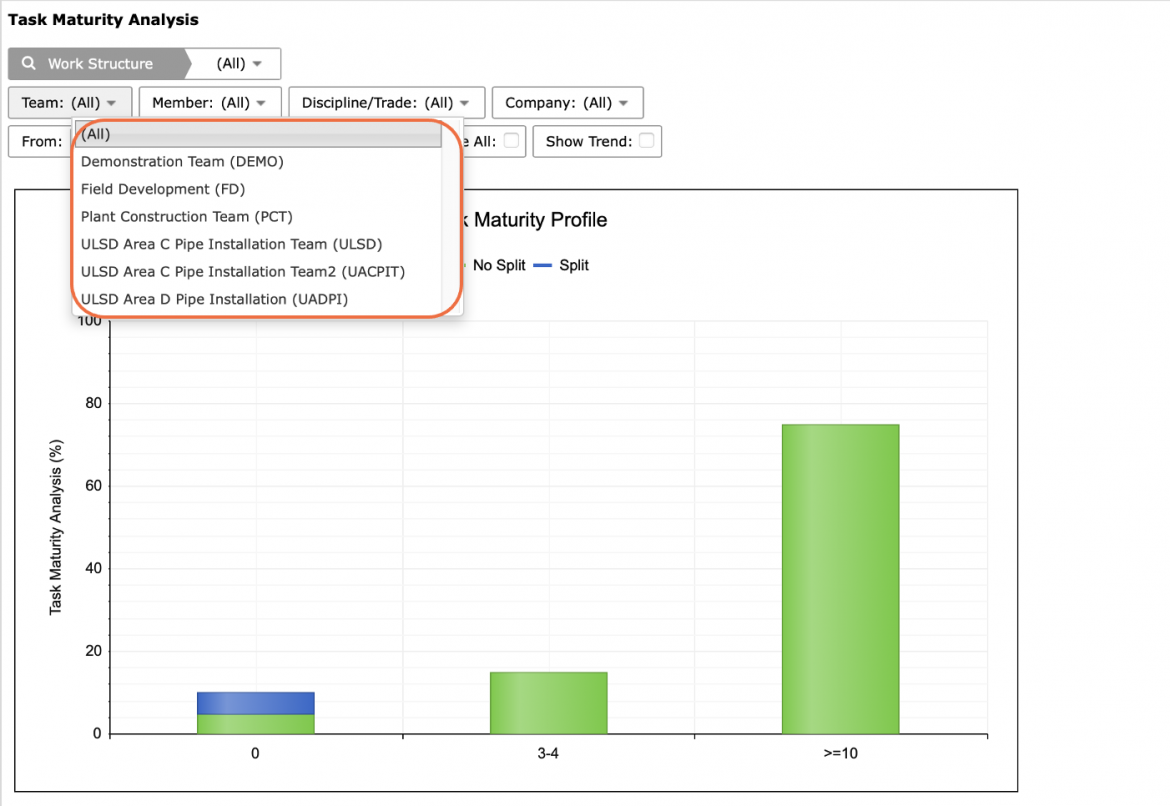
- If a different date range is desired, or no data is visible, adjust the From and To dates or check: Include All, to show all historical data.
The legend elements: No Split and Split, are clickable and toggle to display / hide data.
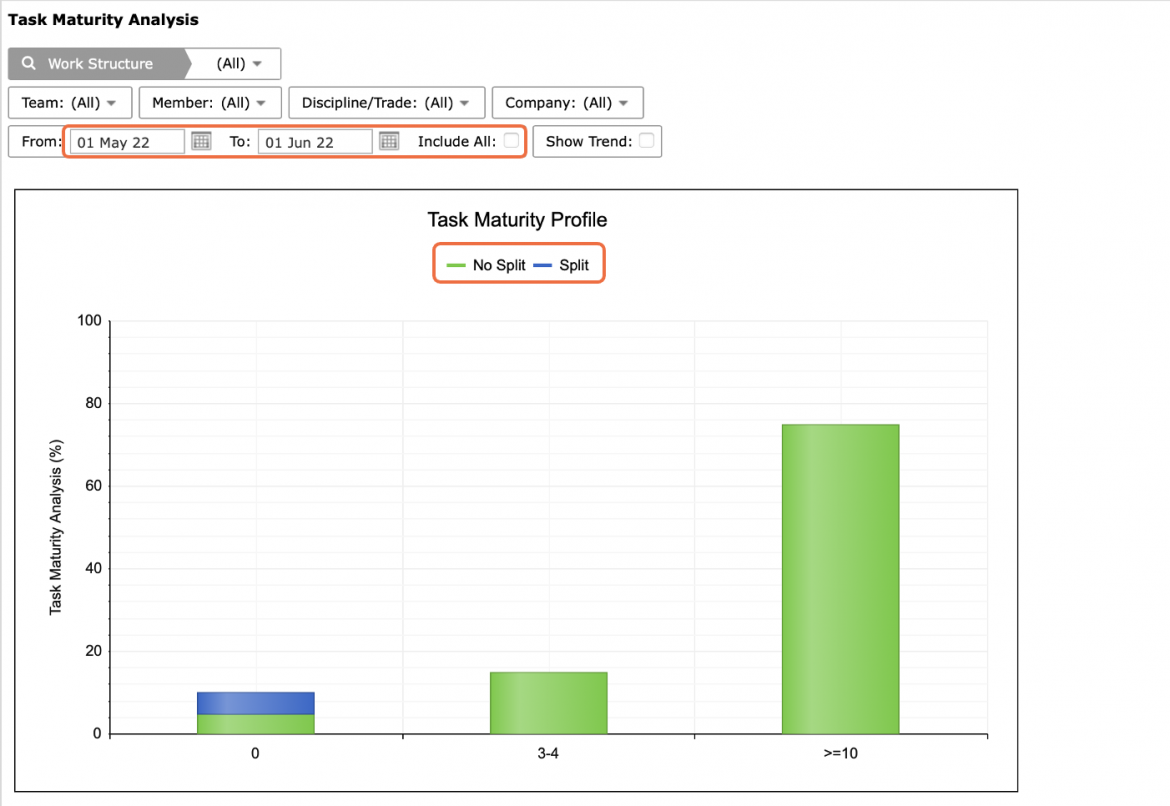
- Also use the Pin icon in the top right of the graph to include Task Maturity Analysis in your Dashboard.
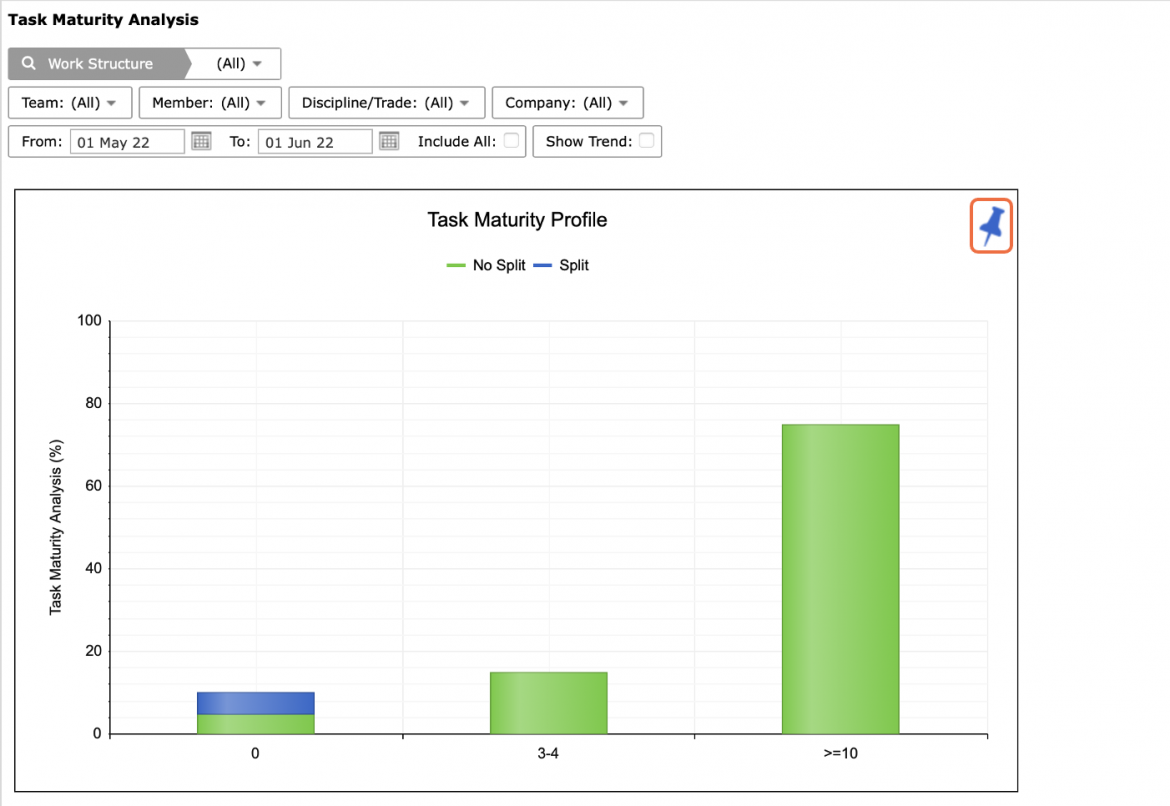
- For the selected team(s), Task Maturity Analysis displays task maturity values in percentage format, for Milestones / Tasks created in SPS|PM: 1) Zero days, 2) One to two days and 3) Greater than or equal to five days, before being committed on a Production Plan. Values for split tasks are shown by the green column and tasks that were not split are shown by the blue column.
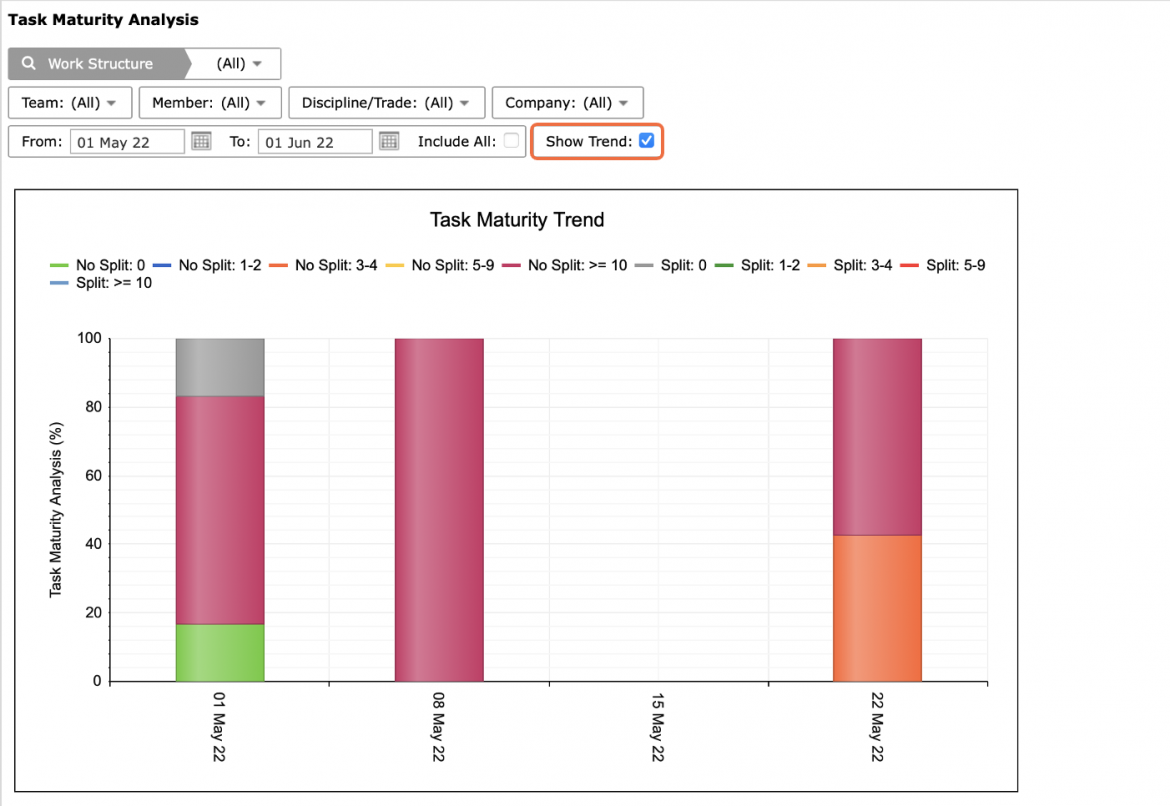
- To view the Task Maturity Analysis trend, click the Show Trend checkbox.
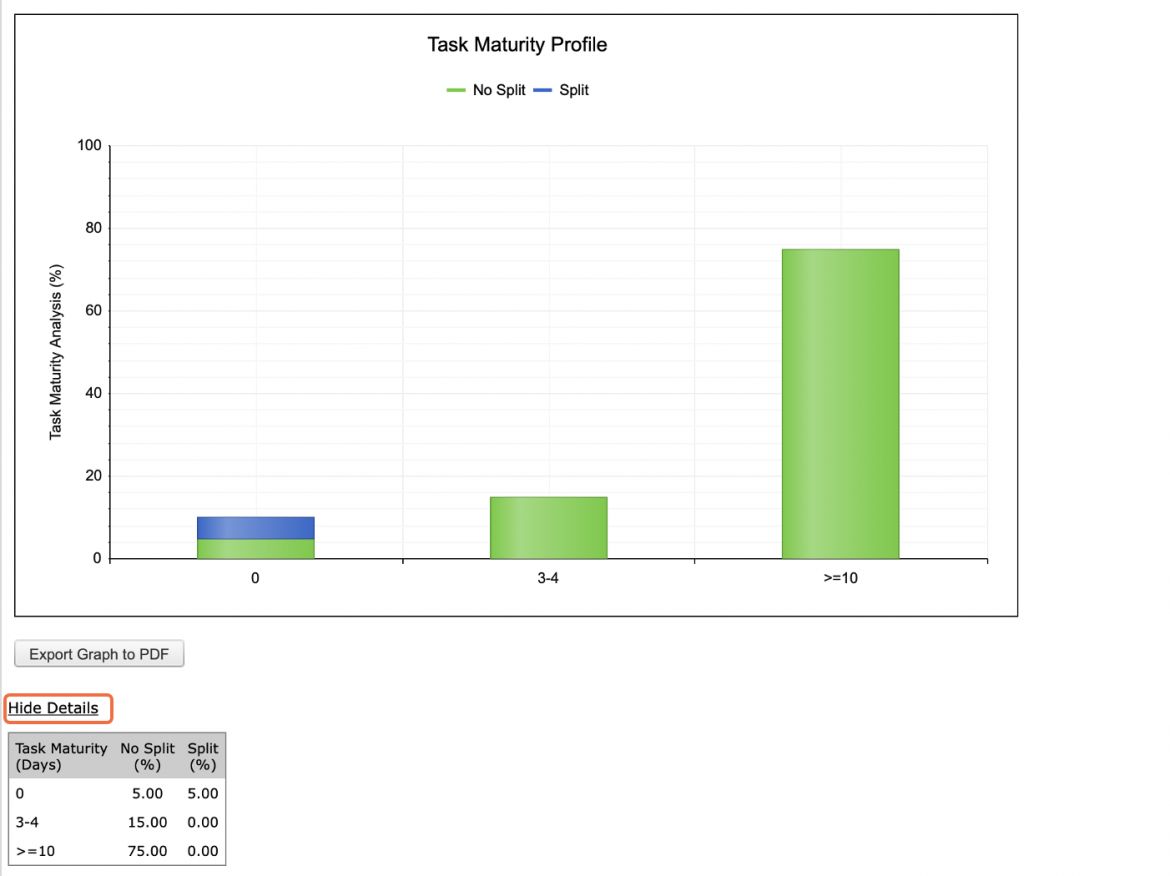
- To view the data behind the Task Maturity Analysis occurrences for each category (for all past Production Plans), click Show Details below the graph. To hide the data click: Hide Details.
For each category, the data table lists the percentage of (split and not split) Milestones / Tasks created in SPS|PM: 1) Zero days, 2) One to two days and 3) Greater than or equal to five days, before being committed on a Production Plan.
- In addition to viewing Task Maturity Analysis for a single team, to view an aggregate Task Maturity Analysis for all teams select: All, under the Team drop-down.
This feature totals the percentages of (split and not split) Milestones / Tasks created in SPS|PM: 1) Zero days, 2) One to two days and 3) Greater than or equal to five days, before being committed on a Production Plan, for all teams to show global planning issues across the project.
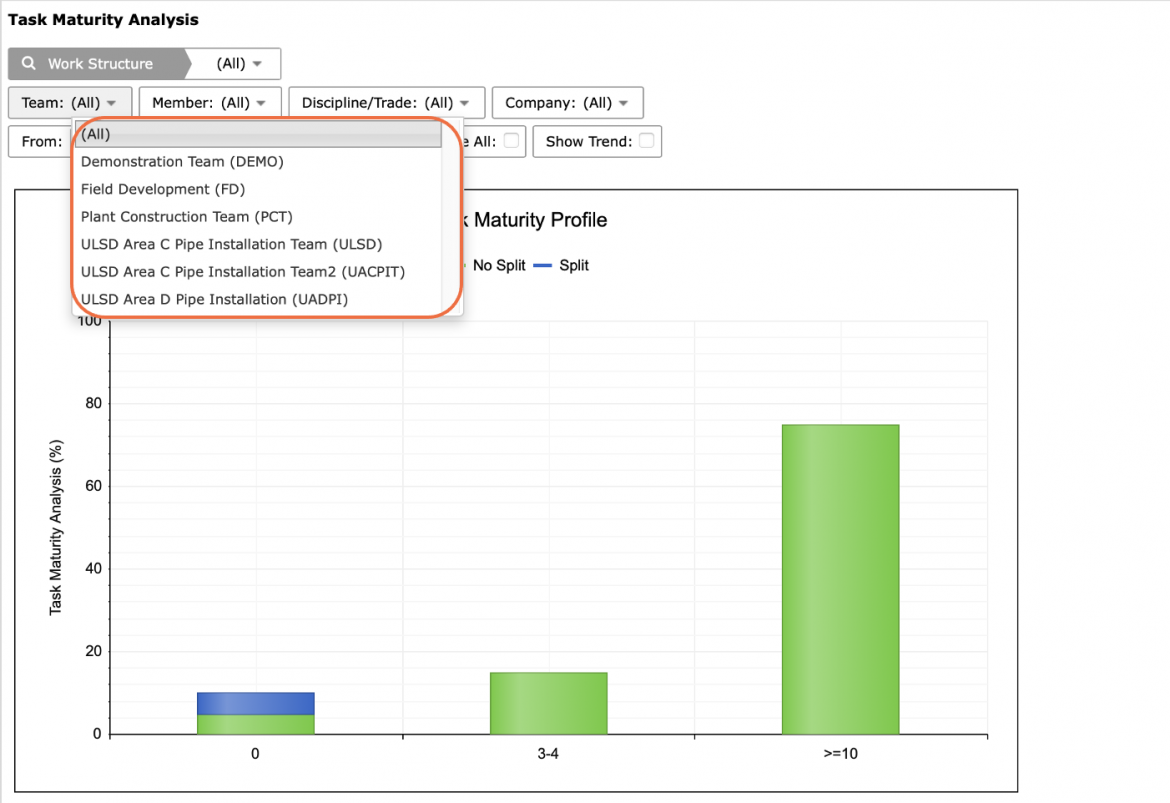
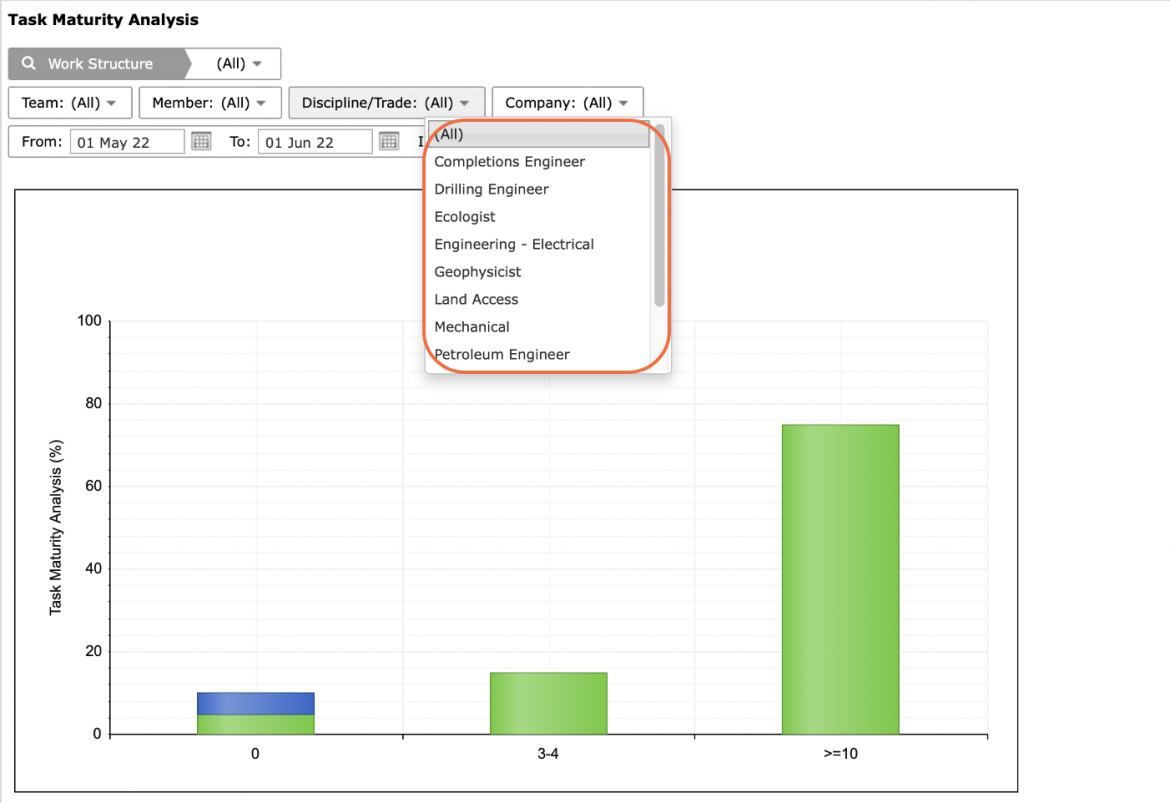
- You can also filter by Member, Company, Discipline / Trade and Work Structure.
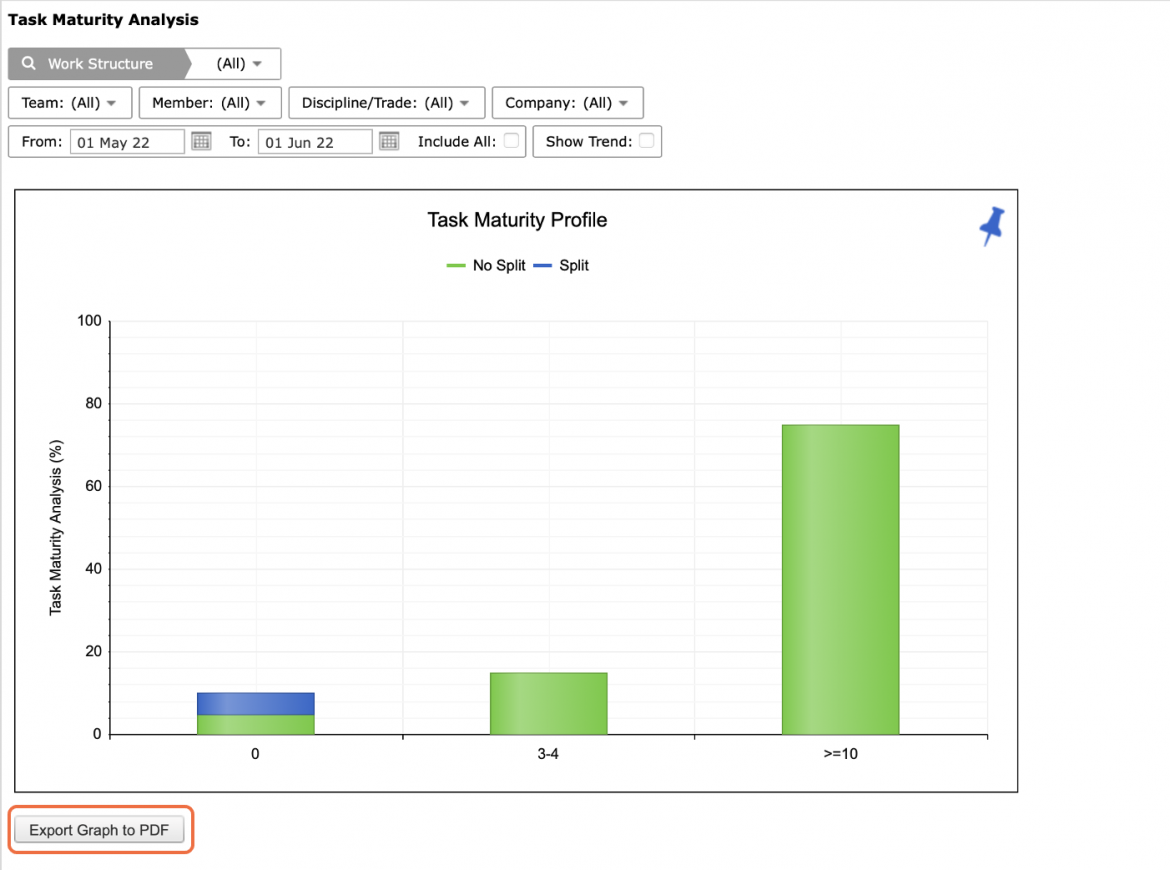
- To export Reasons Summary to a PDF file, click the Export Graph to PDF button and follow the prompts according to the specific browser you are using.
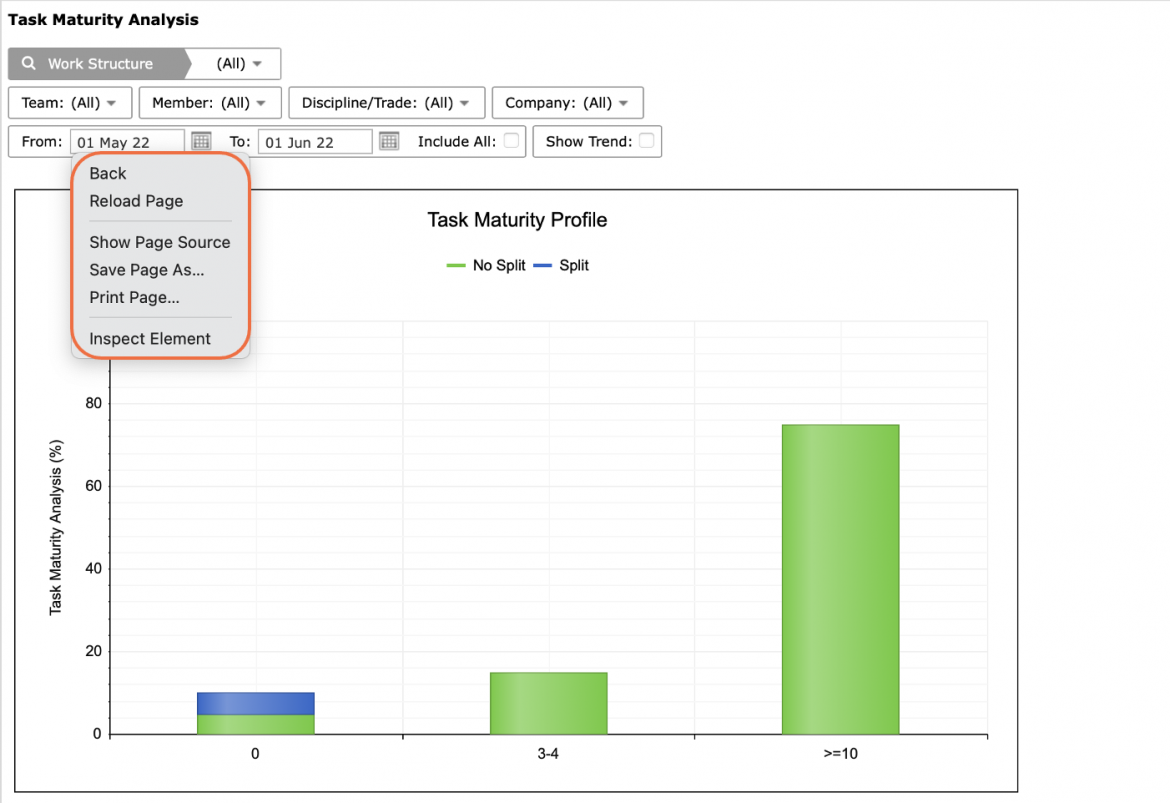
- To print Task Maturity Analysis, options may differ based on your browser. For instance, if you are using Internet Explorer, right-click in the white space outside of the Task Maturity Analysis graph and select Print from the menu or simultaneously press the Ctrl and P keys on your keyboard.
- The Print Dialogue box opens.
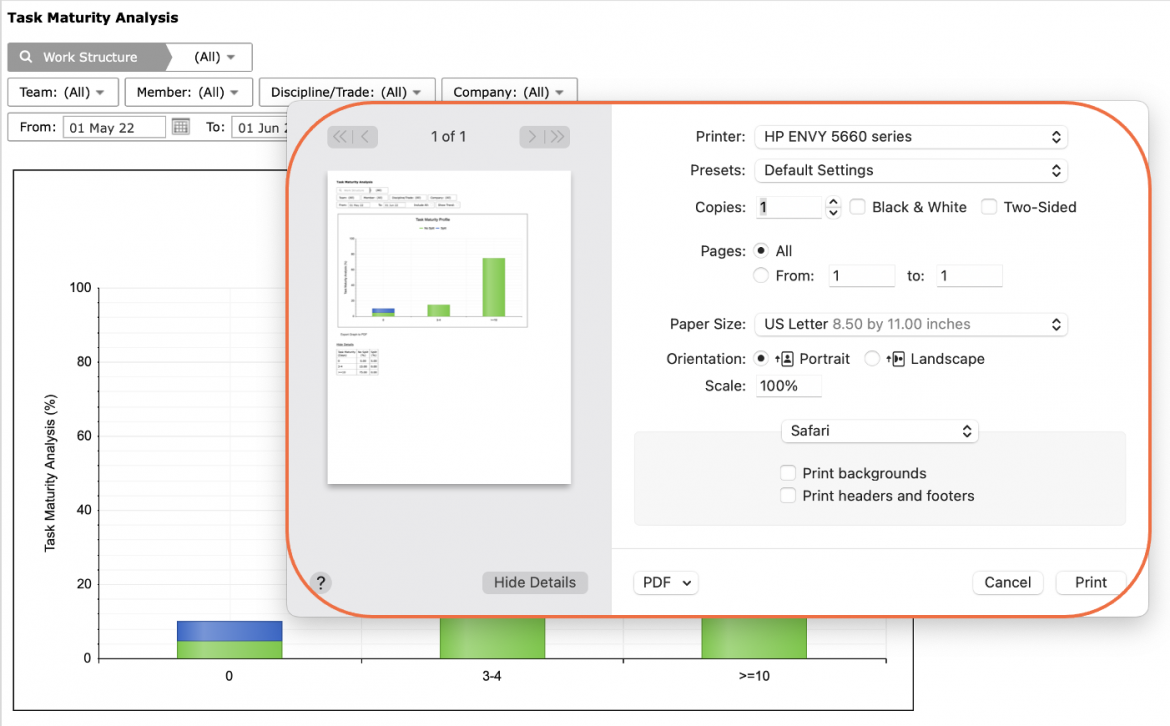
- Once all relevant printing settings have been modified, click the Print button.
Note: Before printing, it is recommended you confirm the fit to the desired paper size.