
Understanding how optimizing process design, reducing variability and effectively using resources (capacity, inventory, and time) impact project objectives is critical for Performance Improvement. To assess this impact, Milestone Forecast Trend provides the change over time in LRM Finish Date and Forecast Start Date for a specific Milestone starting from a selected date.
Milestone Forecast Trend answers the question, “Are Milestones (and hand-offs) consistently gaining or losing days?” If they are, the project team should examine Standard Process Analysis to determine if standard process durations are too long or too short. If the durations are correct, the team should examine queue time in Standard Process Analysis and also Root Cause Analysis to determine and eliminate the source(s) of variability to the optimal extent possible.
To access Milestone Forecast Trend, complete the steps below:
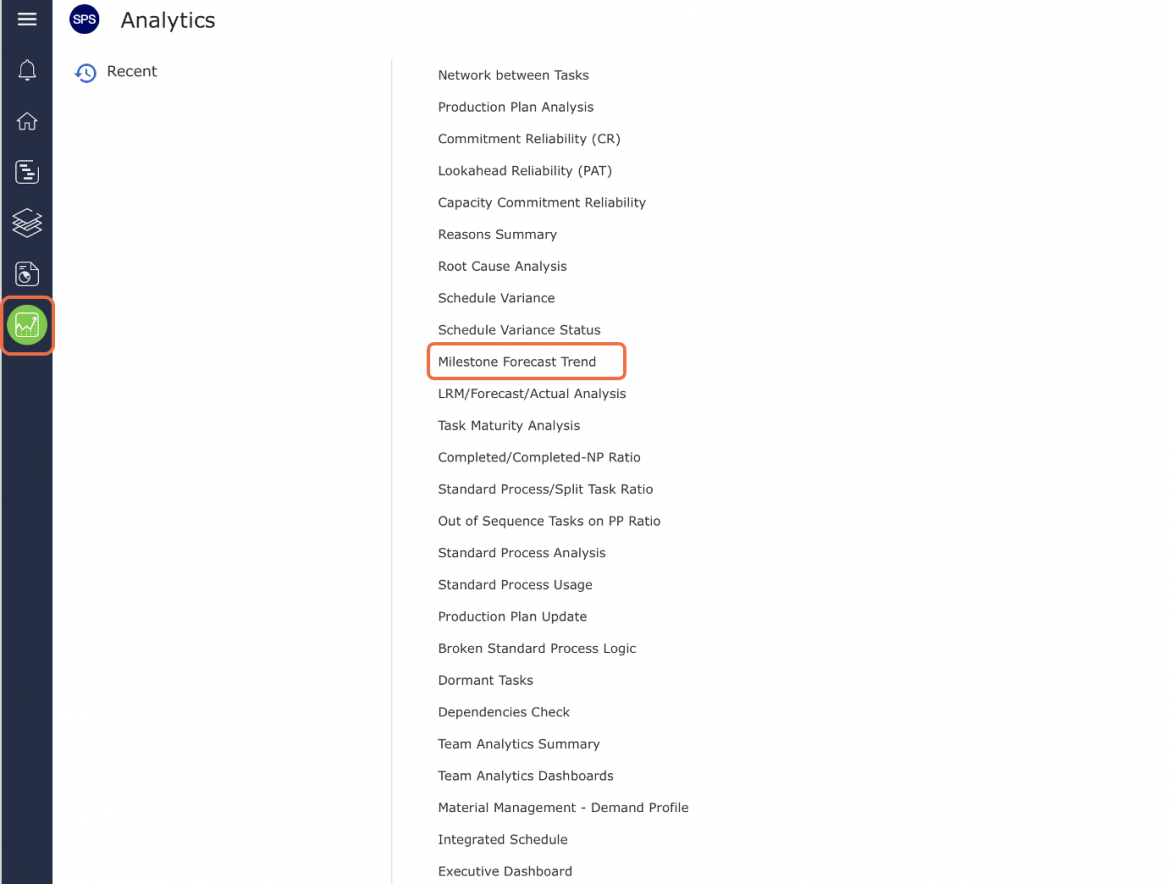
- From the Main Navigation Bar select Analytics, then select Milestone Forecast Trend.
- Milestone Forecast Trend opens in a new window and automatically displays the Analytic for the selected Milestone with the default date range of two weeks from the current date.
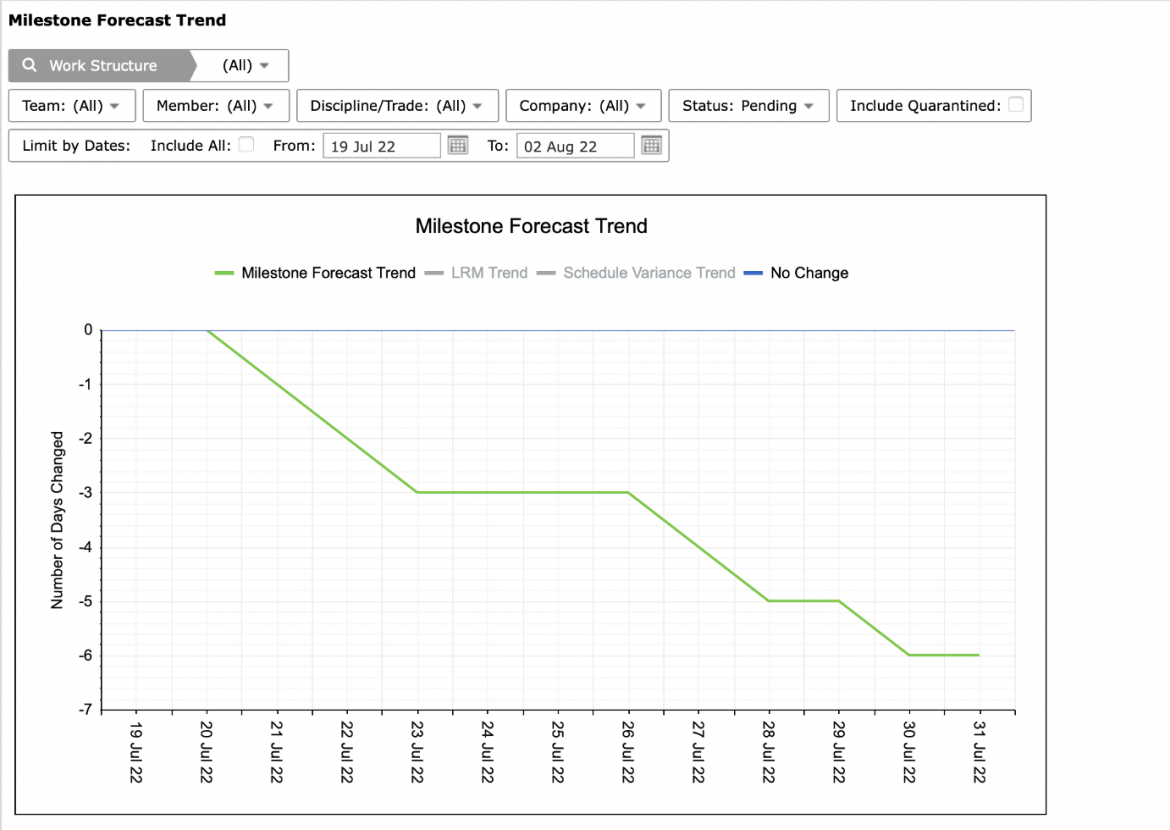
- If a different date range is desired, or no data is visible, adjust the From and To dates or check: Include All, to show all historical data.
The legend elements: Milestone Forecast Trend, LRM Trend, Schedule Variance Trend and No Change are clickable and toggle to display / hide data.
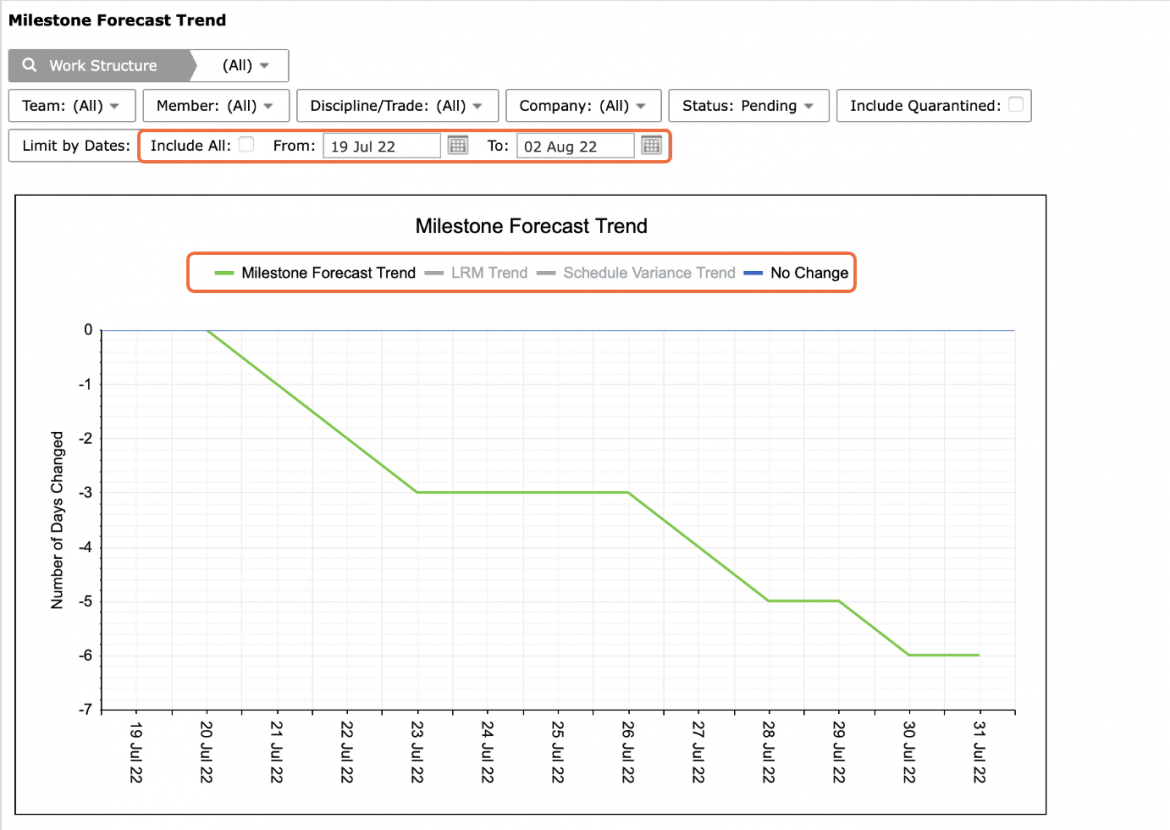
- Also use the Pin icon in the top right of the graph to include Milestone Forecast Trend in your Dashboard.
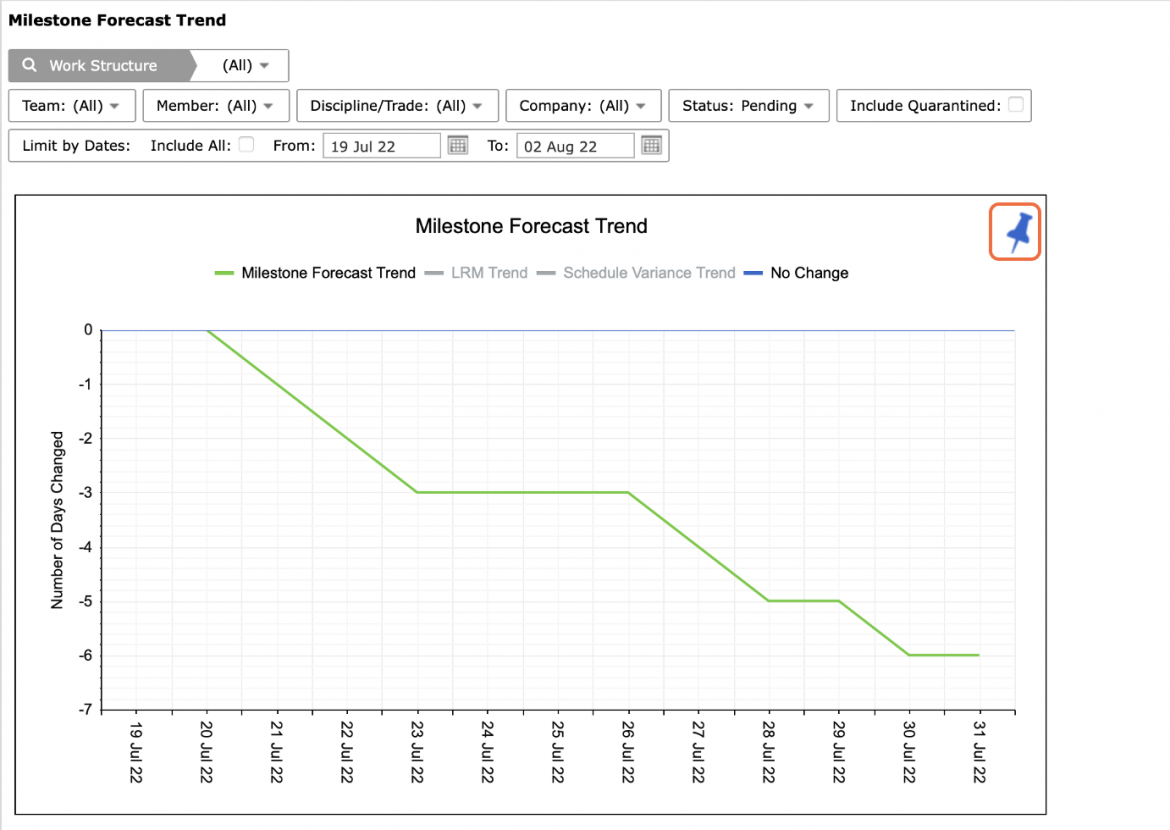
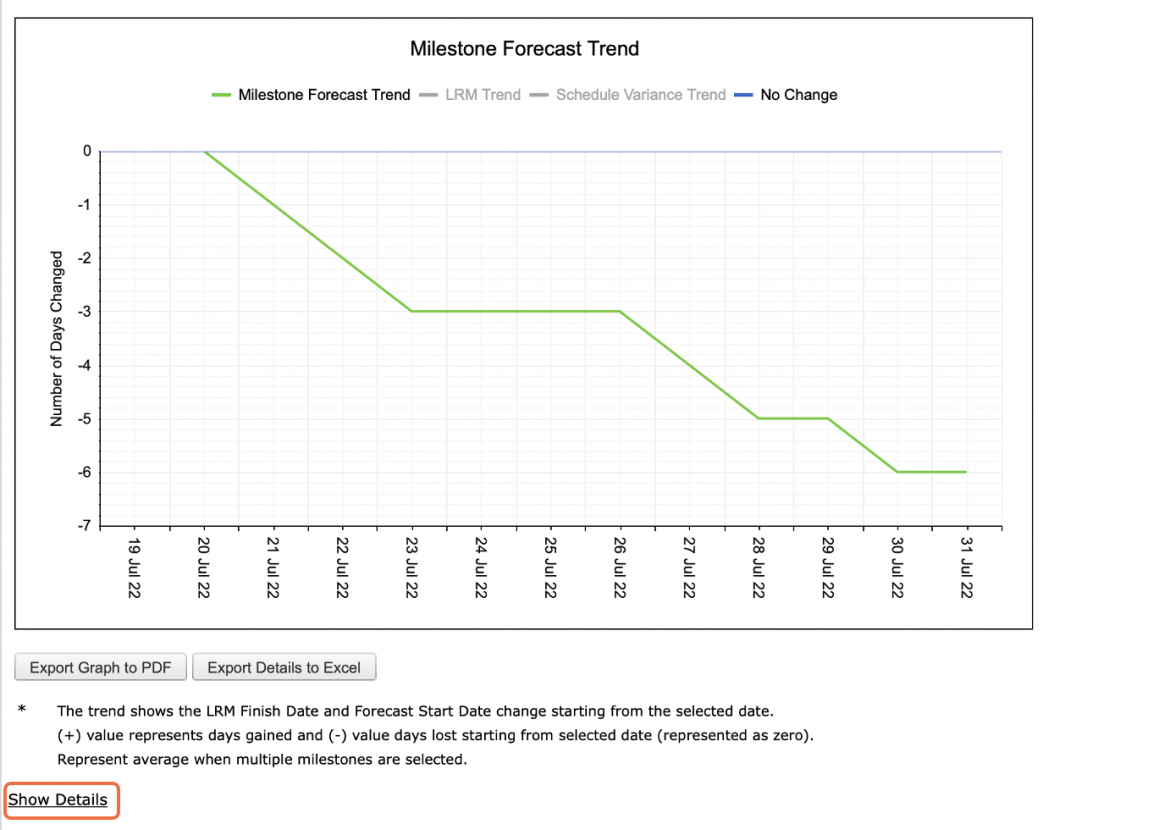
- For the selected Milestone, Milestone Forecast Trend displays the LRM Finish Date and Forecast Start Date change starting from the selected date (green line). The (+) value represents days gained and (-) value days lost starting from selected date (represented as zero).
If multiple Milestones are simultaneously selected, Milestone Forecast Trend will display the average trend.
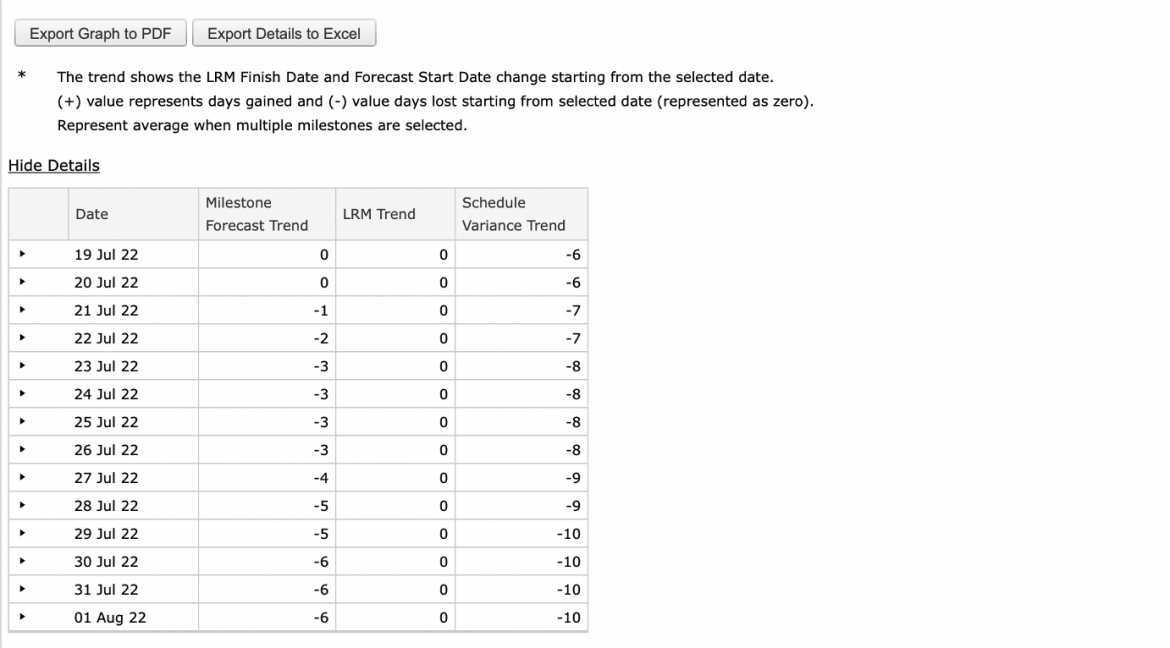
- To view the data behind the Milestone Forecast Trend, click Show Details beneath the graph. To hide the data click: Hide Details.
For the selected Milestone, the data table lists the LRM Finish Date and Forecast Start Date change for each date within the selected range.
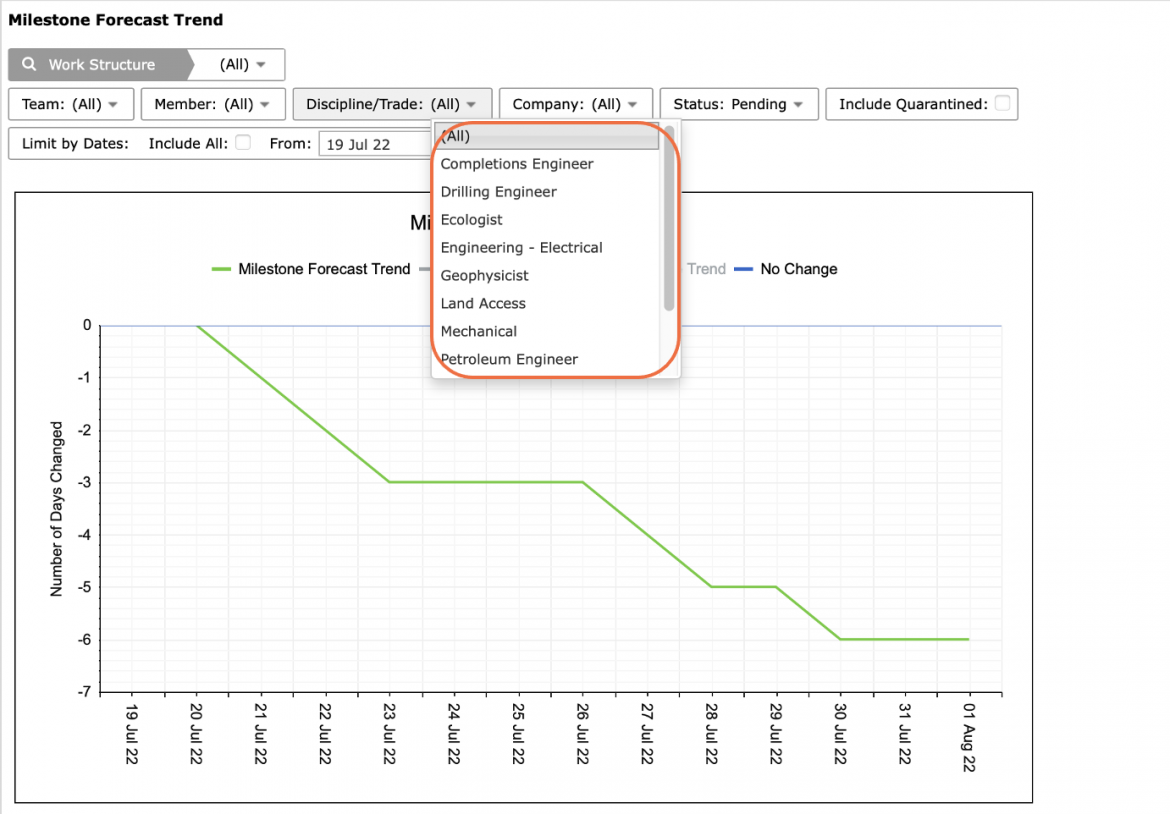
- You can also filter by Member, Company, Discipline / Trade and Work Structure.
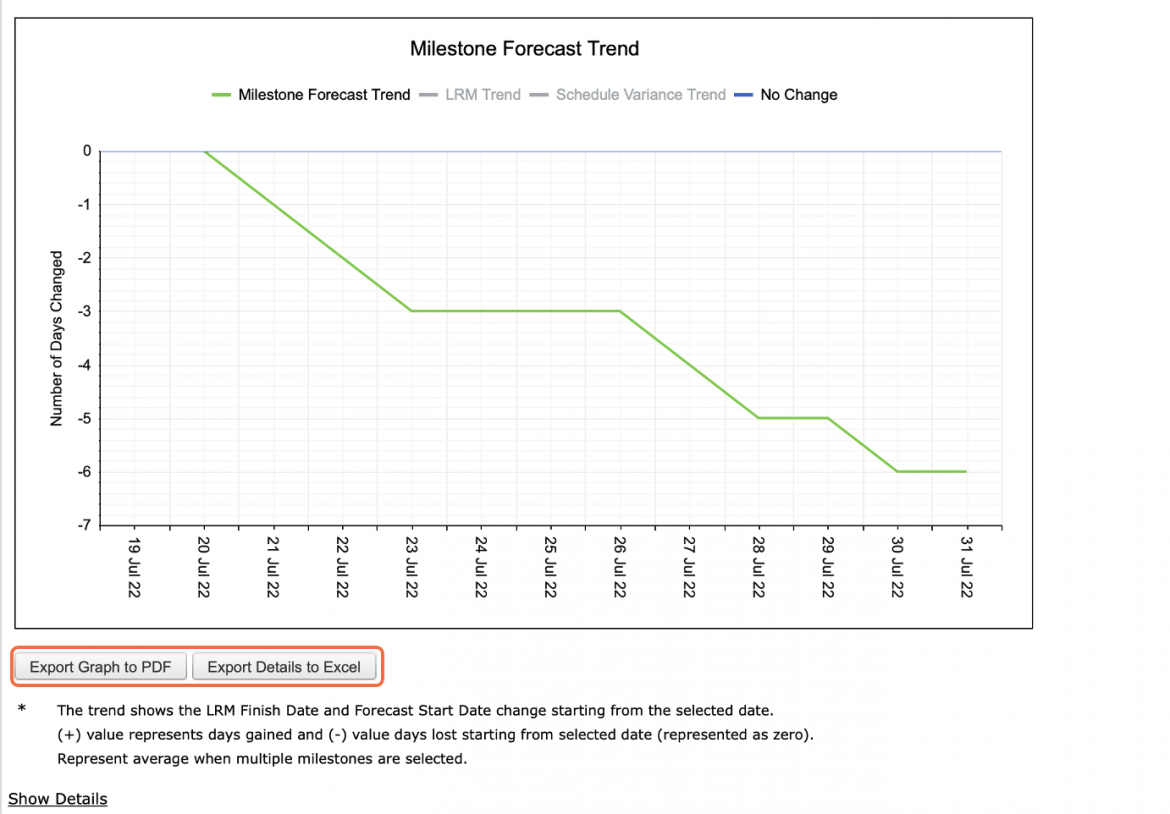
- To export Milestone Forecast Trend to a PDF or Excel file, click the Export Graph to PDF or the Export Details to Excel button and follow the prompts according to the specific browser you are using.
- To print Milestone Forecast Trend, options may differ based on your browser. For instance, if you are using Internet Explorer, right click in the white space outside of the Milestone Forecast Trend graph and select Print from the menu or simultaneously press the Ctrl and P keys on your keyboard.
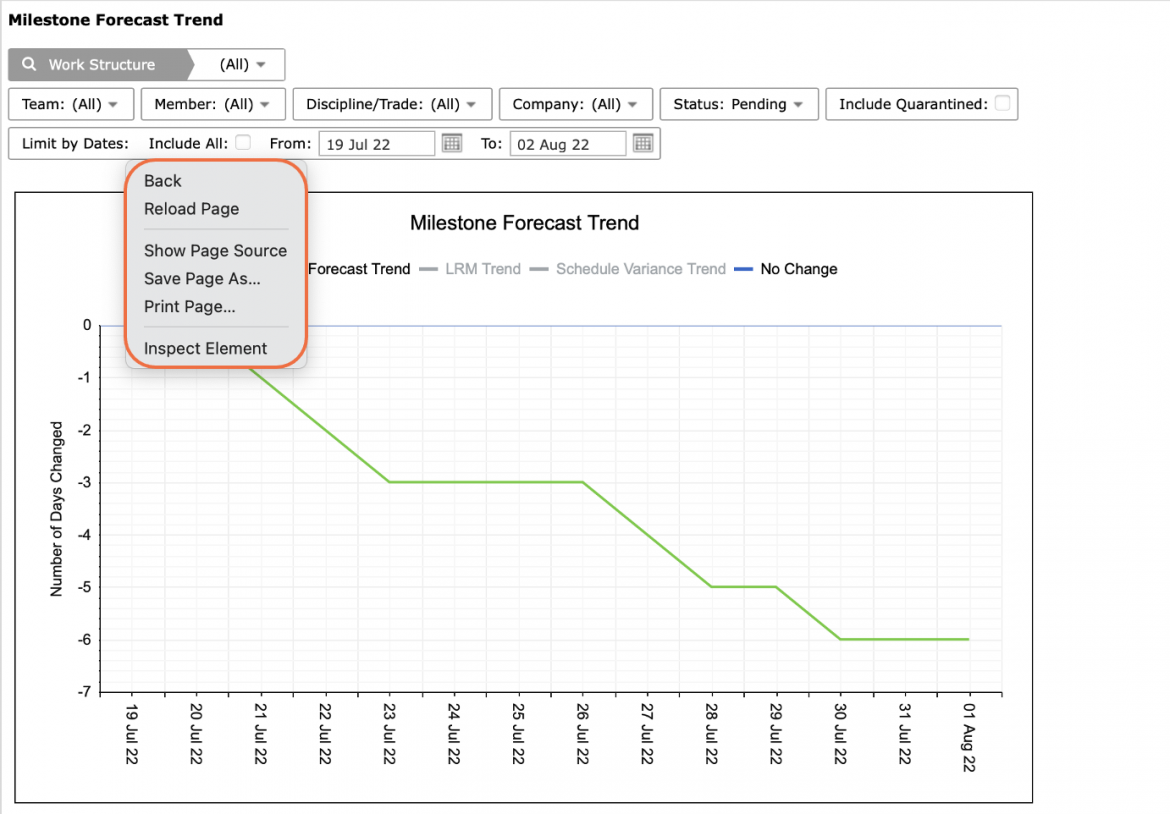
- The Print Dialogue box opens.
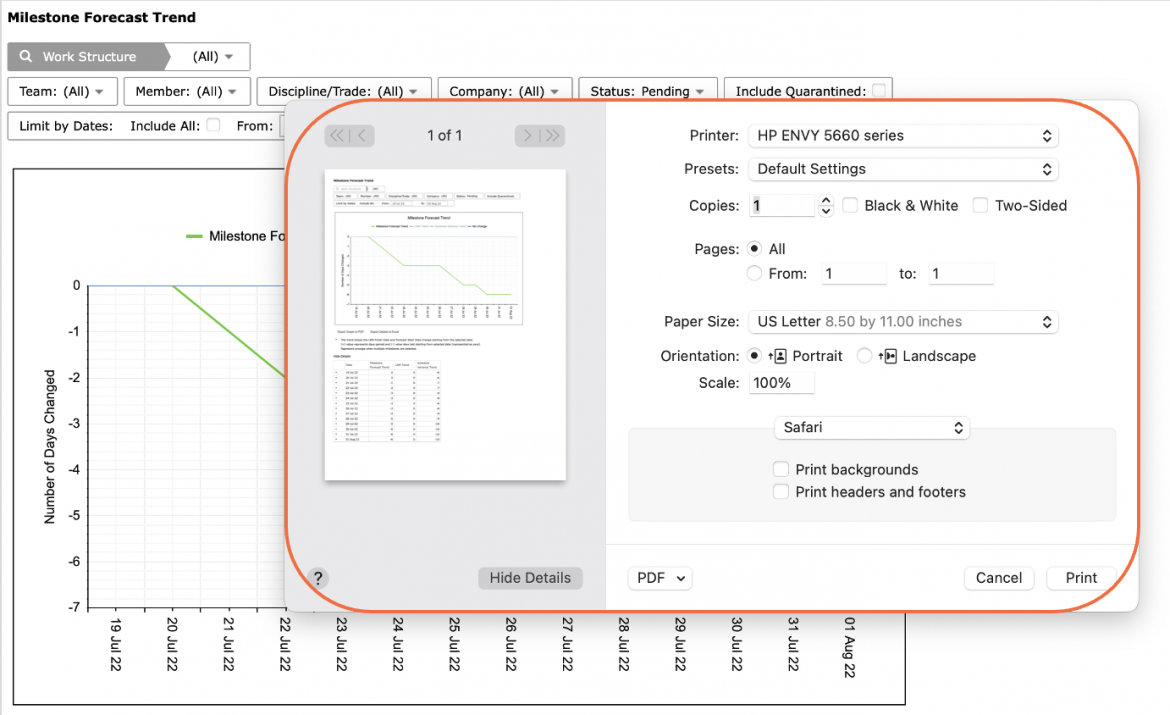
- Once all relevant printing settings have been modified, click the Print button.
Note: Before printing, it is recommended you confirm the fit to the desired paper size.