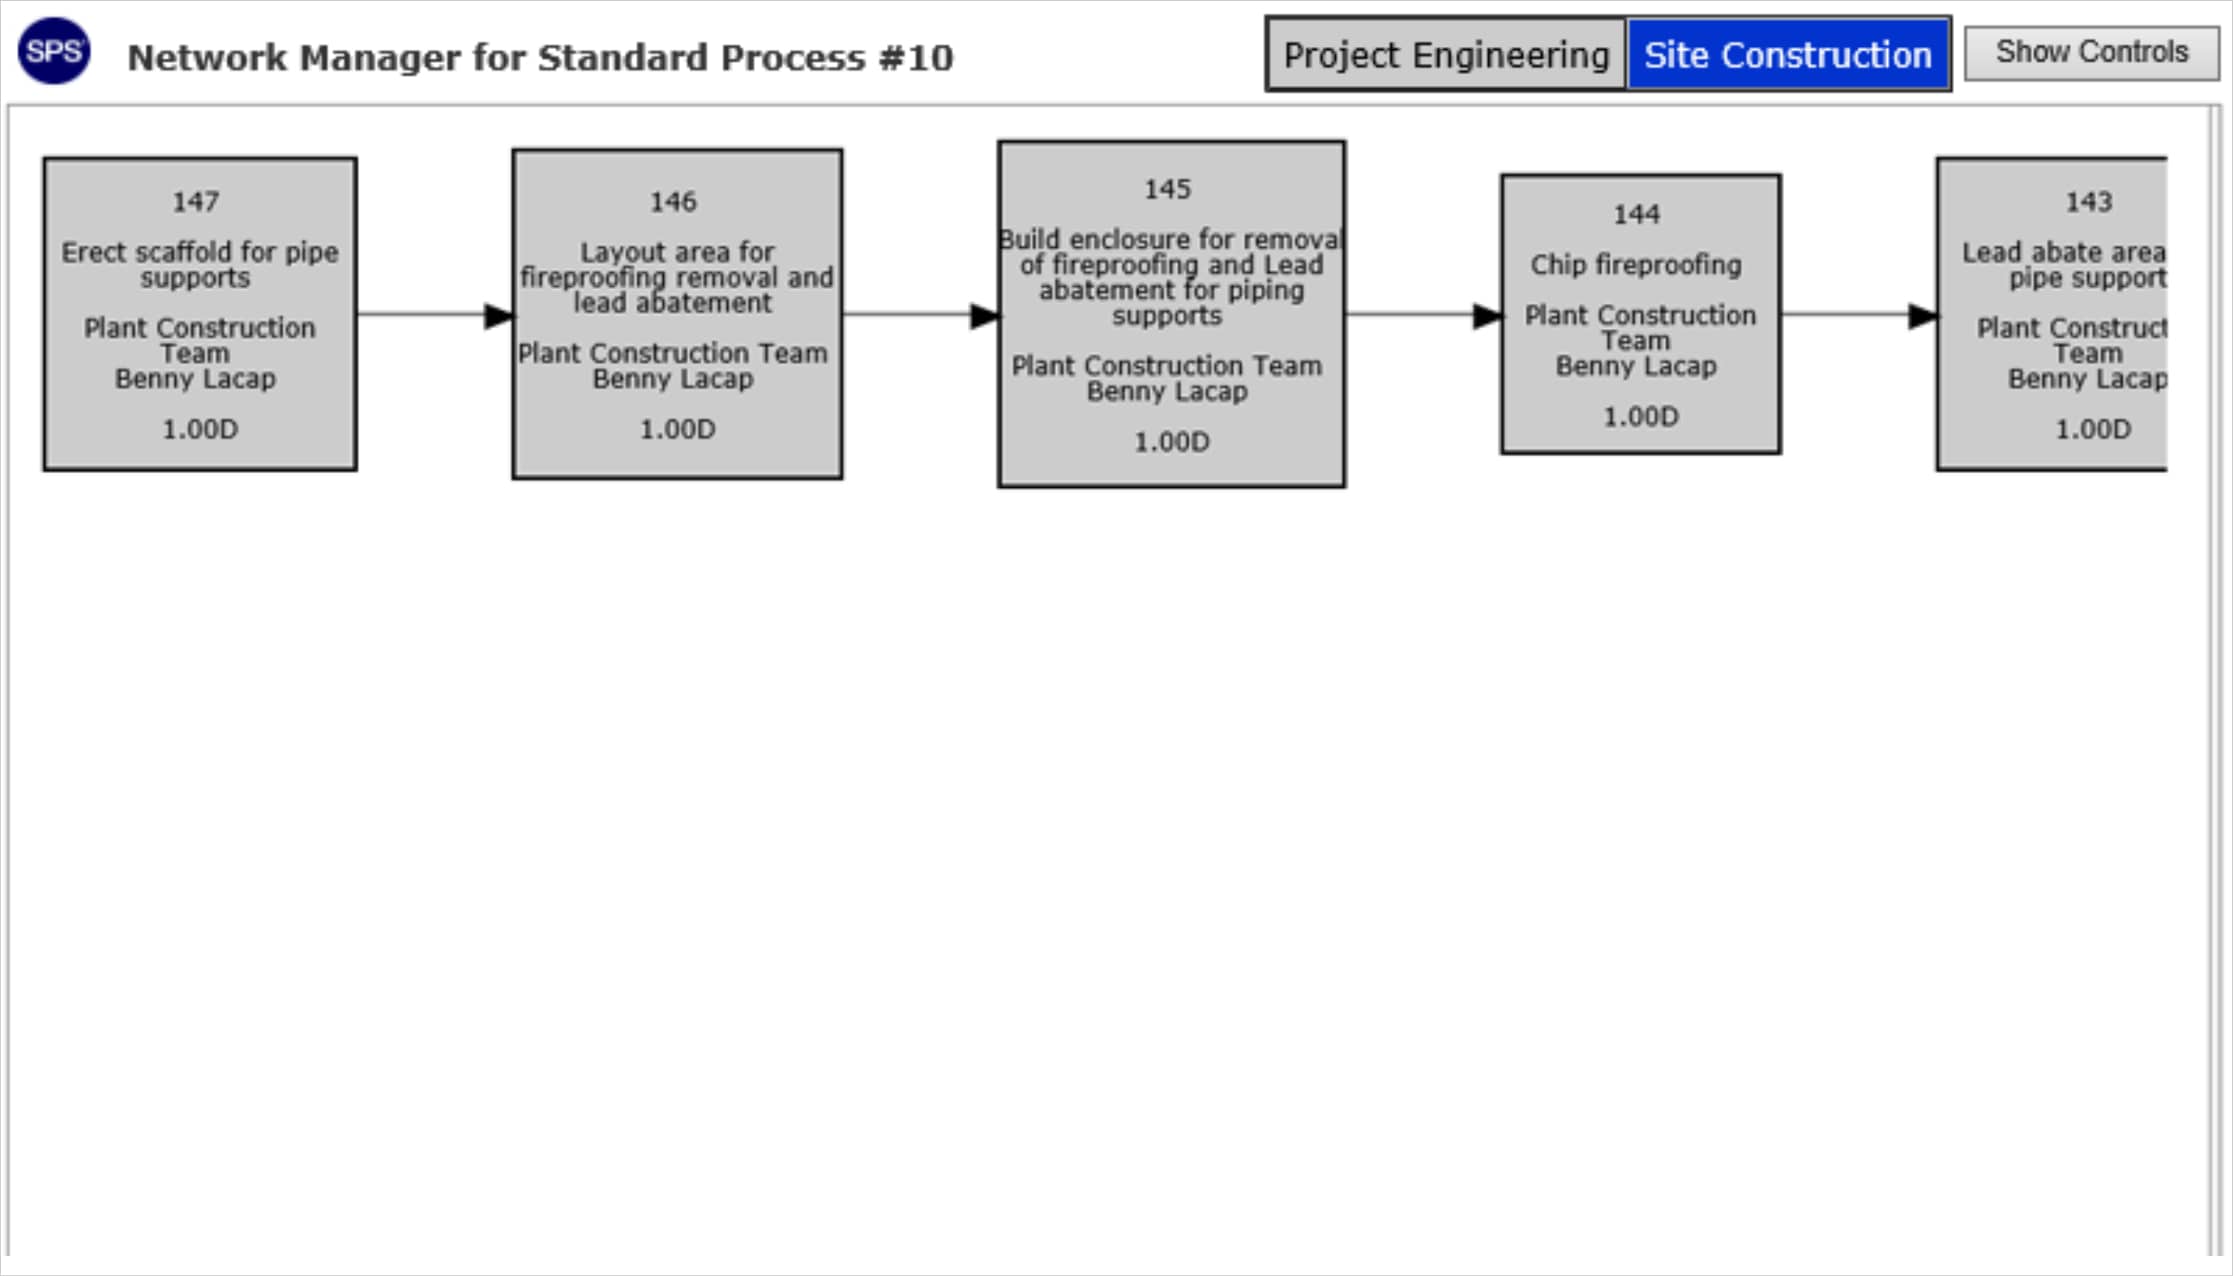
To enable optimization of process design including cycle time reduction, Standard Process Analysis summarizes a series of Analytics automatically produced based on the actual execution of standard processes. As standard process work gets planned, executed and completed, there exists an opportunity to gain a deeper understanding of how the process behaved during execution, and therefore perform an analysis against its original design. More specifically, if planned durations were longer or shorter, and by how much, if time lags between steps were encountered, and how large were they, etc.
Standard Process Analysis answers the question, “Is the standard process(es) designed to minimize variability and optimize use of resources (capacity, inventory and time)?” If the design is not optimal, the project team should take action to improve the standard process. If it is optimal, the team should analyze Commitment Reliability as part of Performance Improvement.
To access Standard Process Analysis, complete the steps below:
- From the Main Navigation Bar select Analytics, then select Standard Process Analysis.

- Standard Process Analysis opens in a new window with the default date range of six months from the current date.
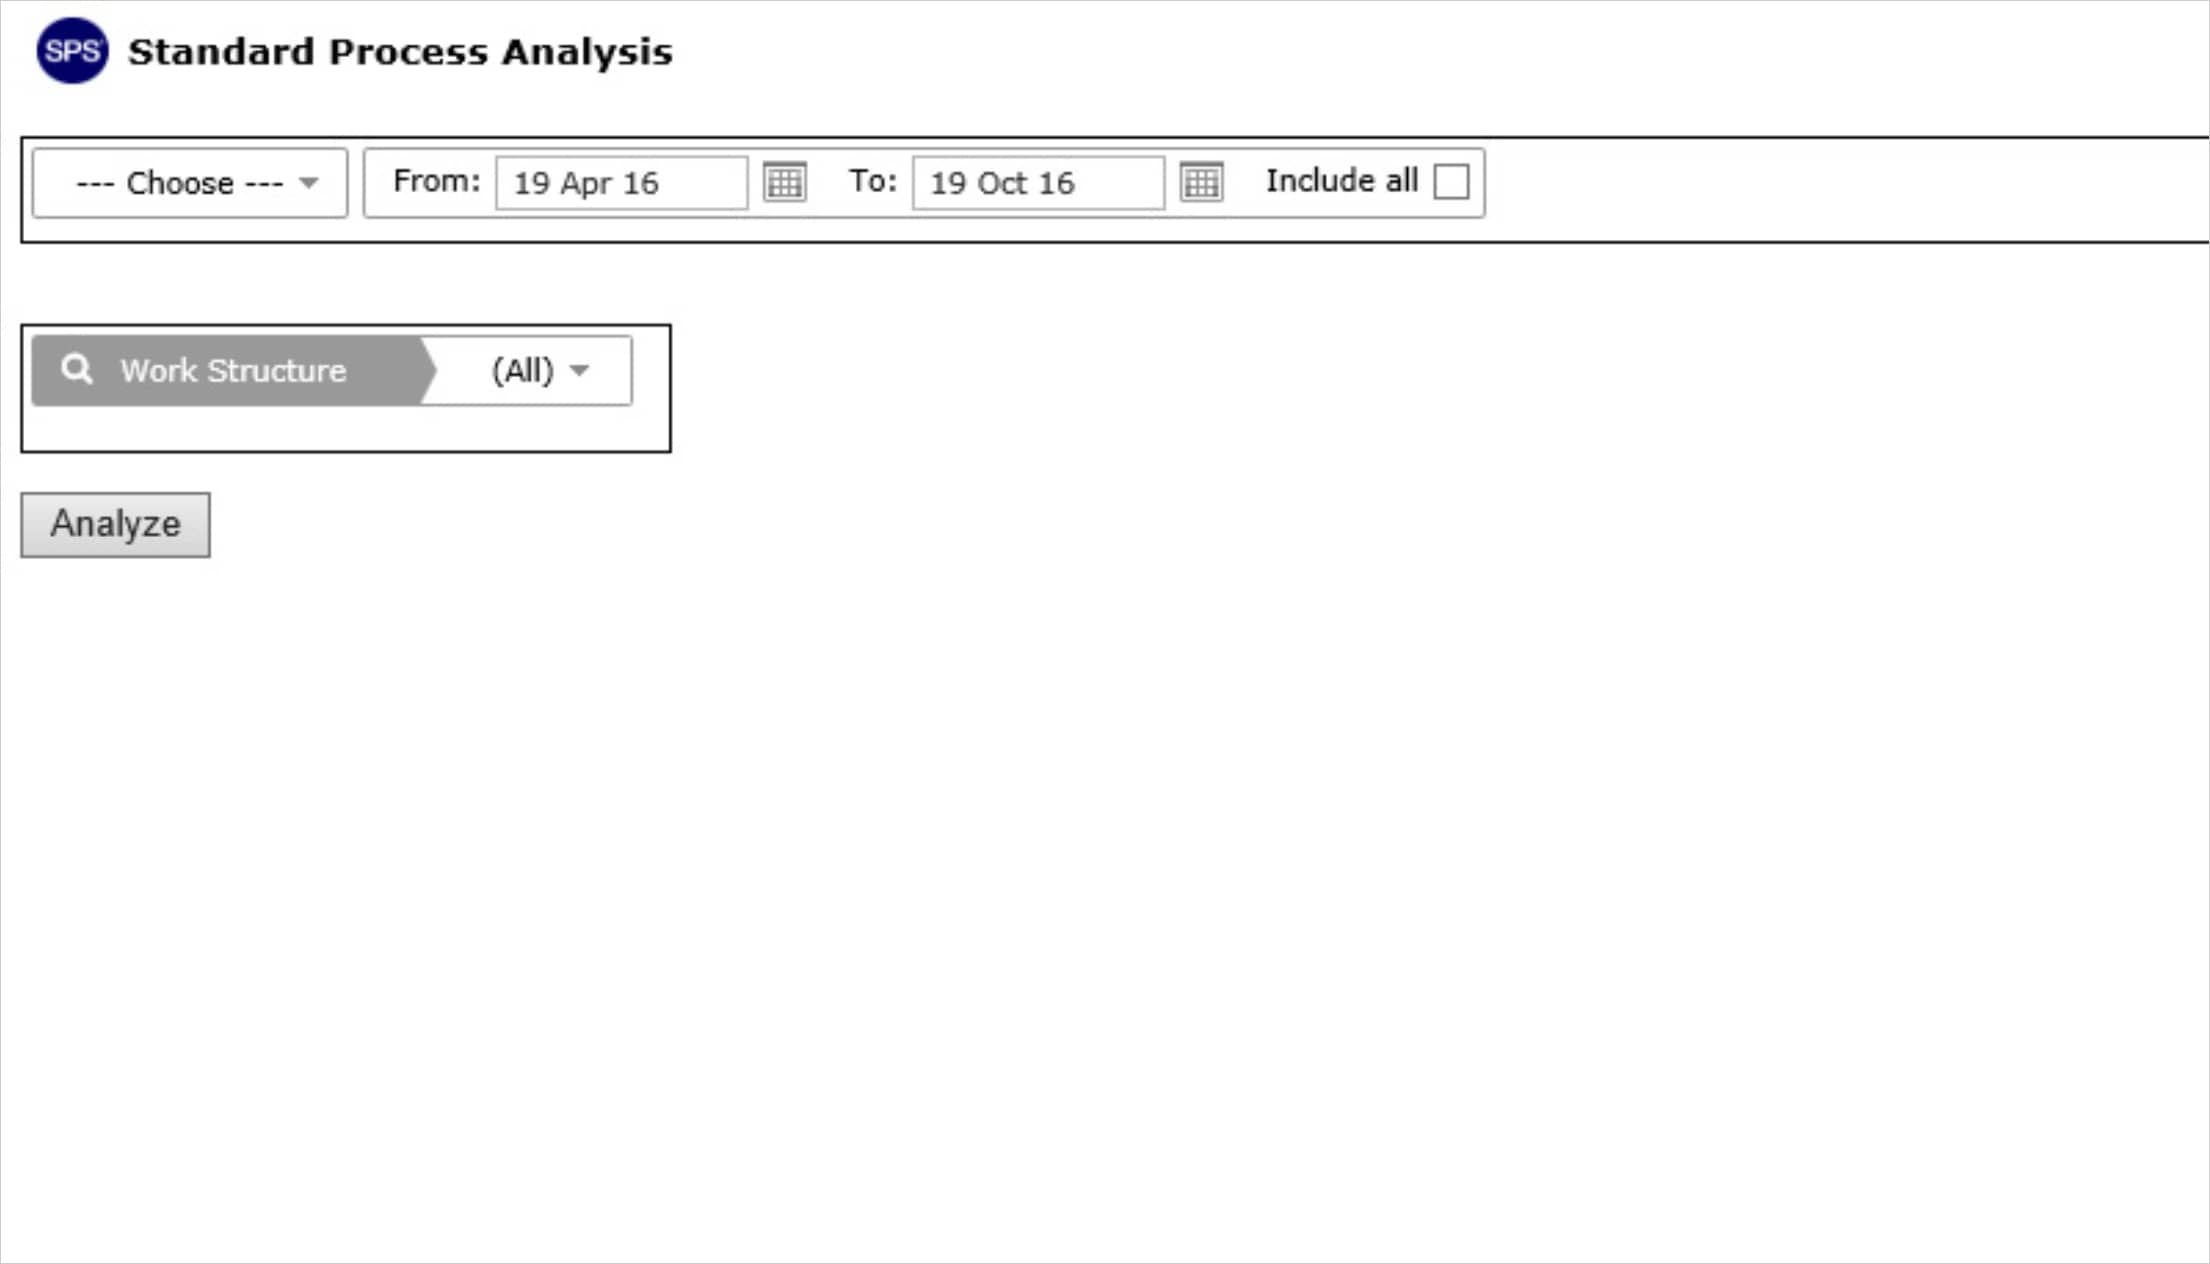
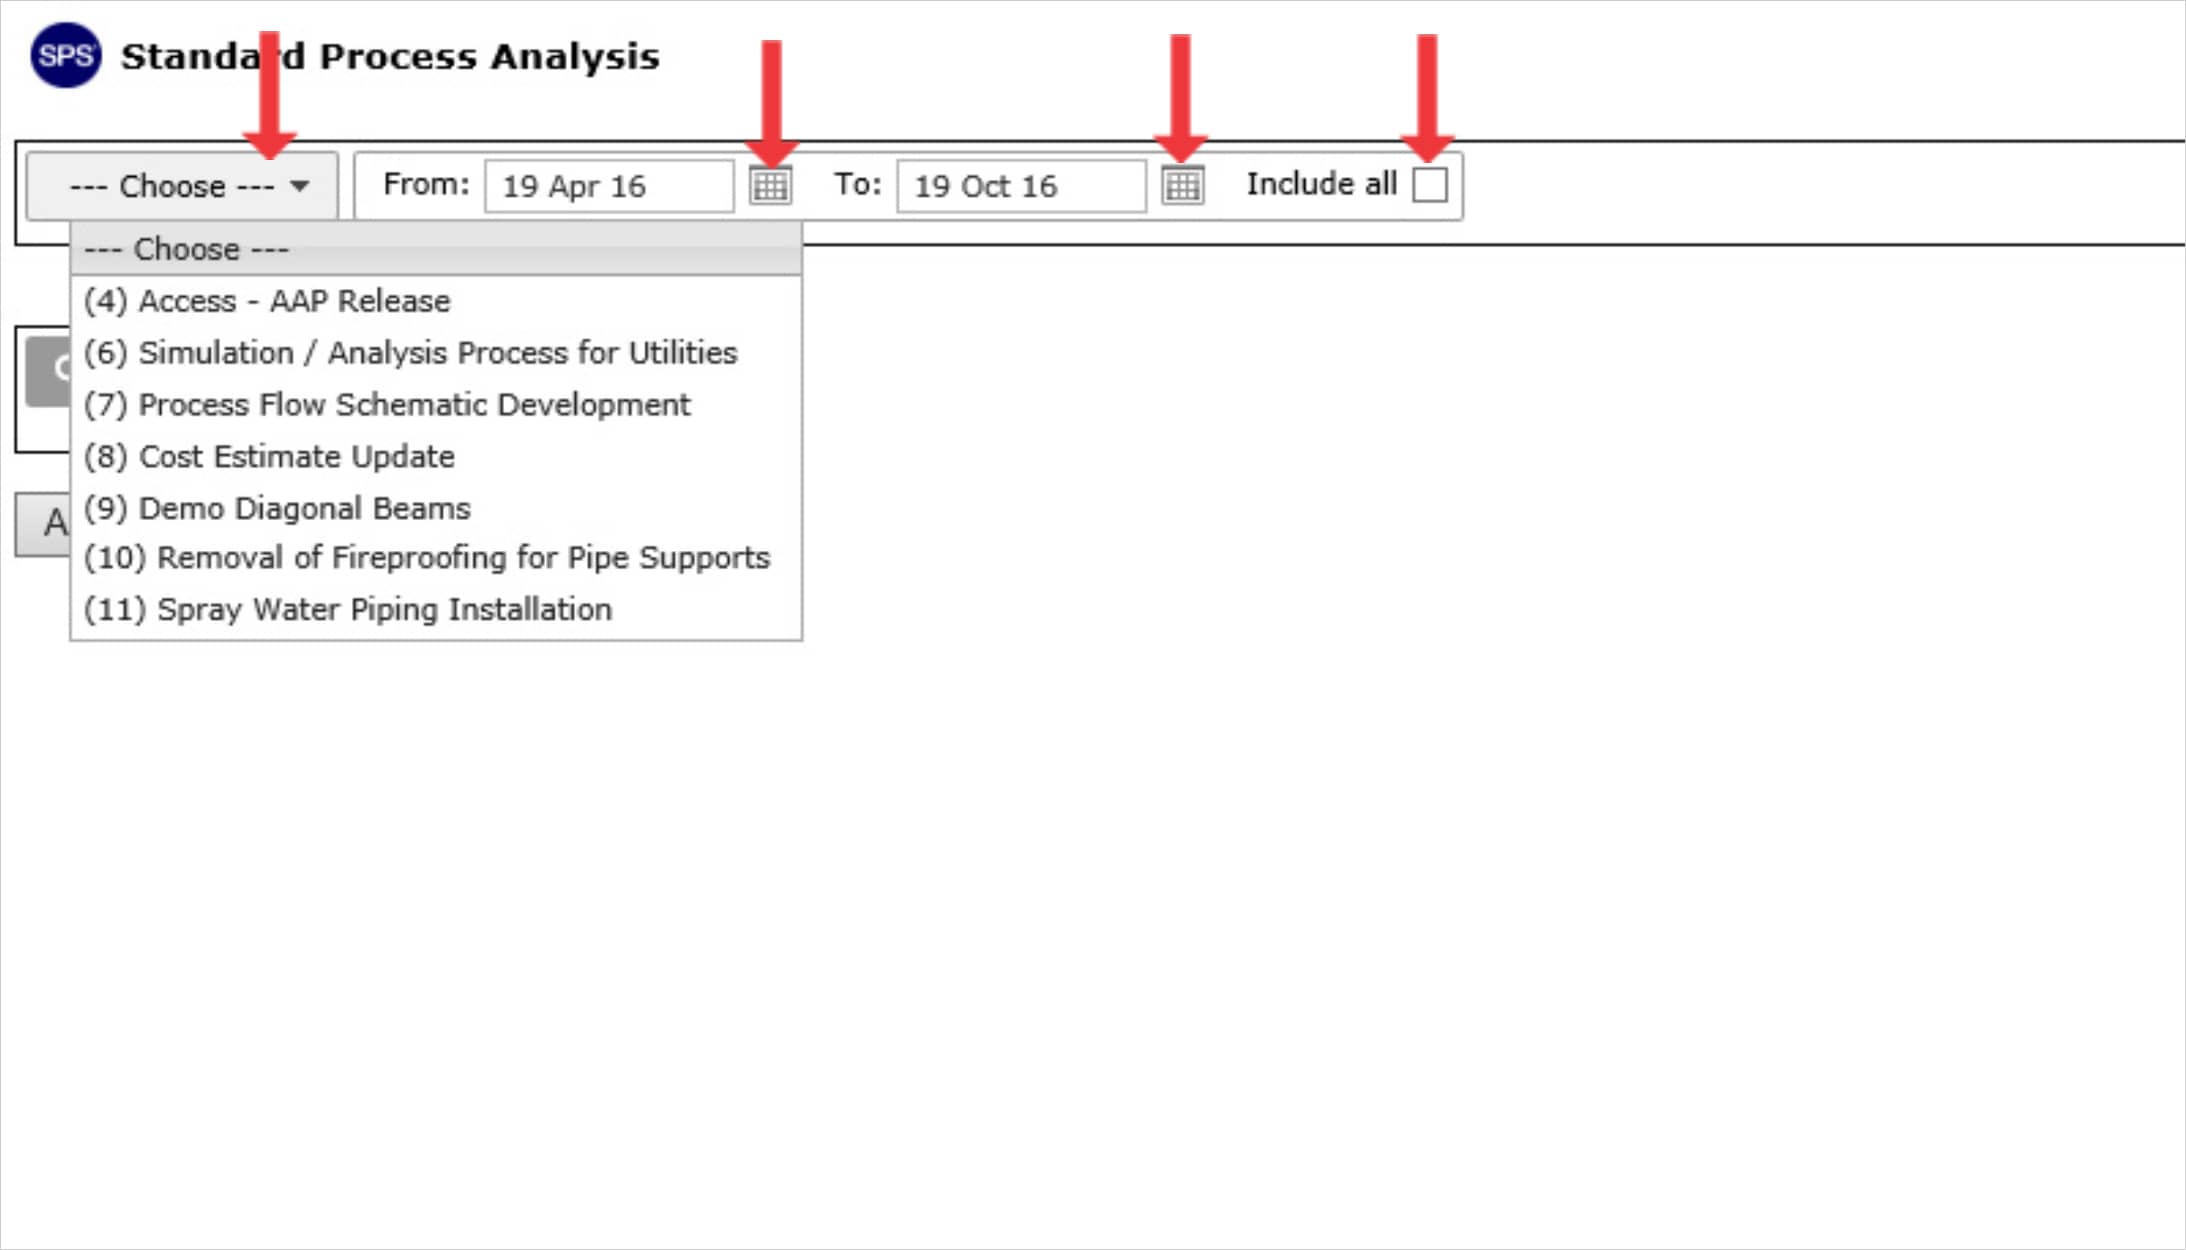
- Select the desired standard process from the drop down menu, desired Work Structure and adjust the From and To dates or check: Include All, to show all historical data, then click the Analyze button.
- For the selected standard process, Standard Process Analysis displays four independent tables (Standard Process Statistics, Task Statistics, Task Root Cause Statistics and Logic Statistics) along with a Gantt Chart view of the standard process will be displayed.The Standard Process Statistics table introduces a high-level analysis of the usage of the selected standard process including how many times the process was completed, compares the standard process duration or planned duration with the average duration based on actual execution, as well as provides the standard deviation with min / max values based on the sample data.
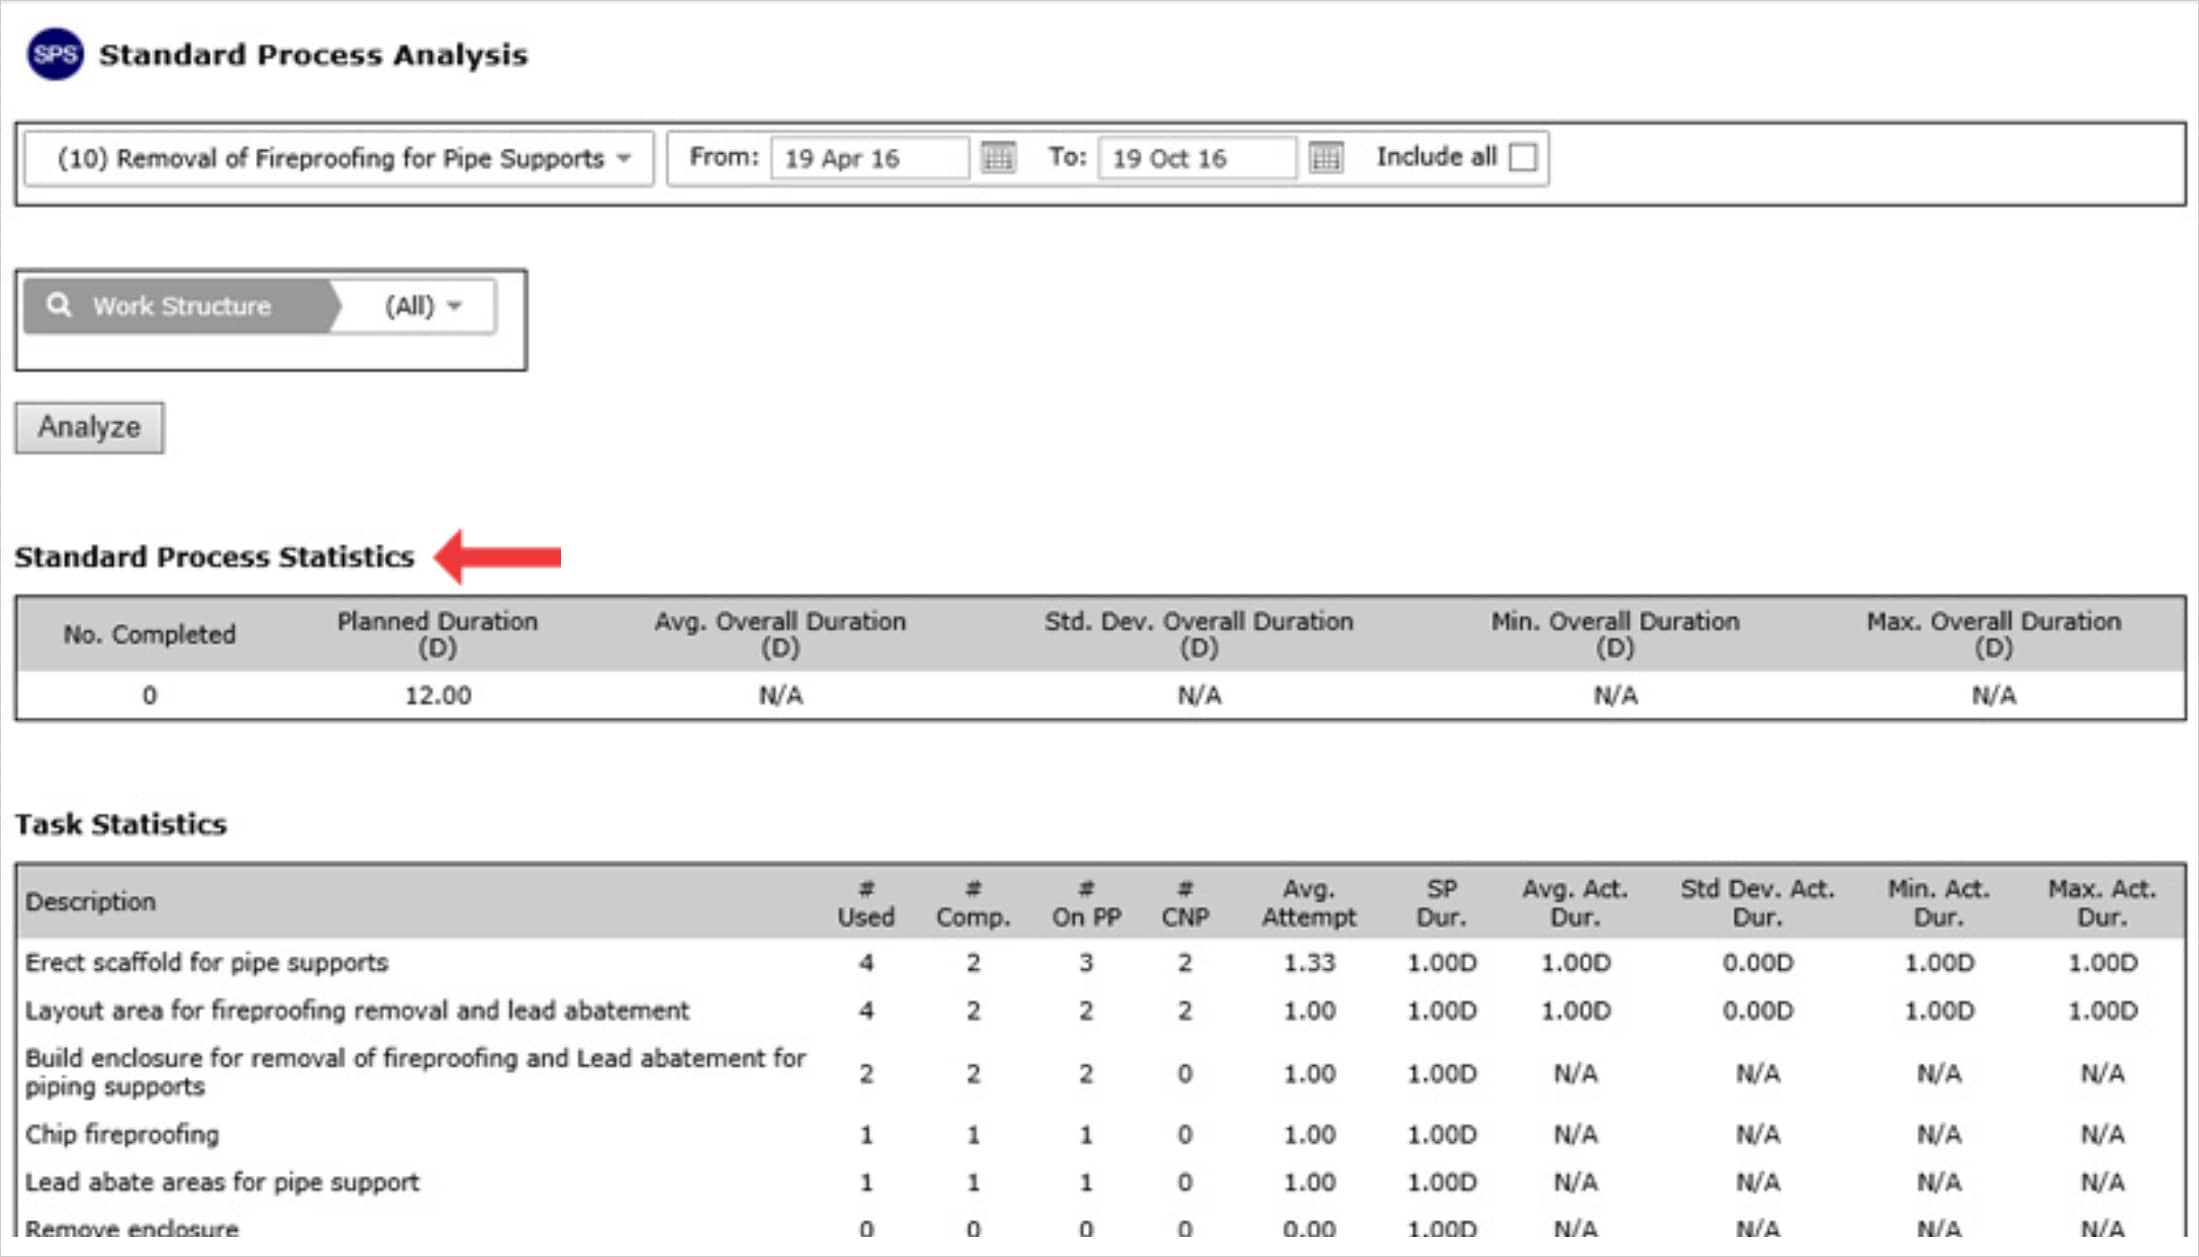
The Task Statistics table introduces a detailed analysis for each of the steps in the selected standard processes including the number of times a task was loaded to the Lookahead, how many times a task was completed (through Production Plans and Completed Not Planned), average attempt, the task duration as set in the standard process and the average actual duration together with standard deviation and min / max values.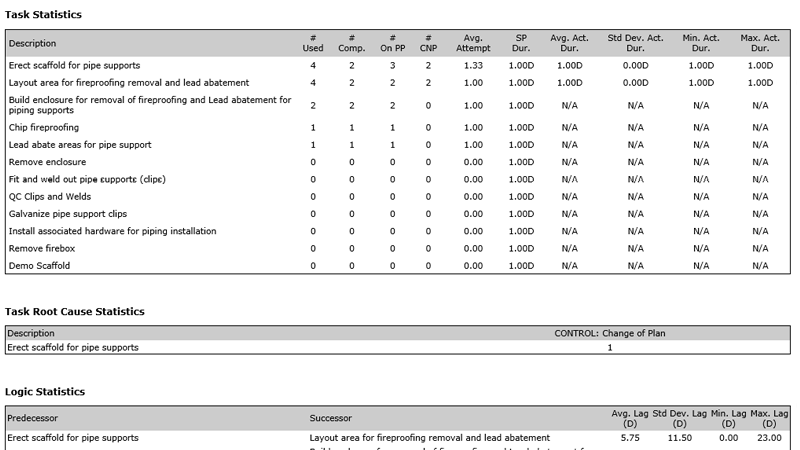
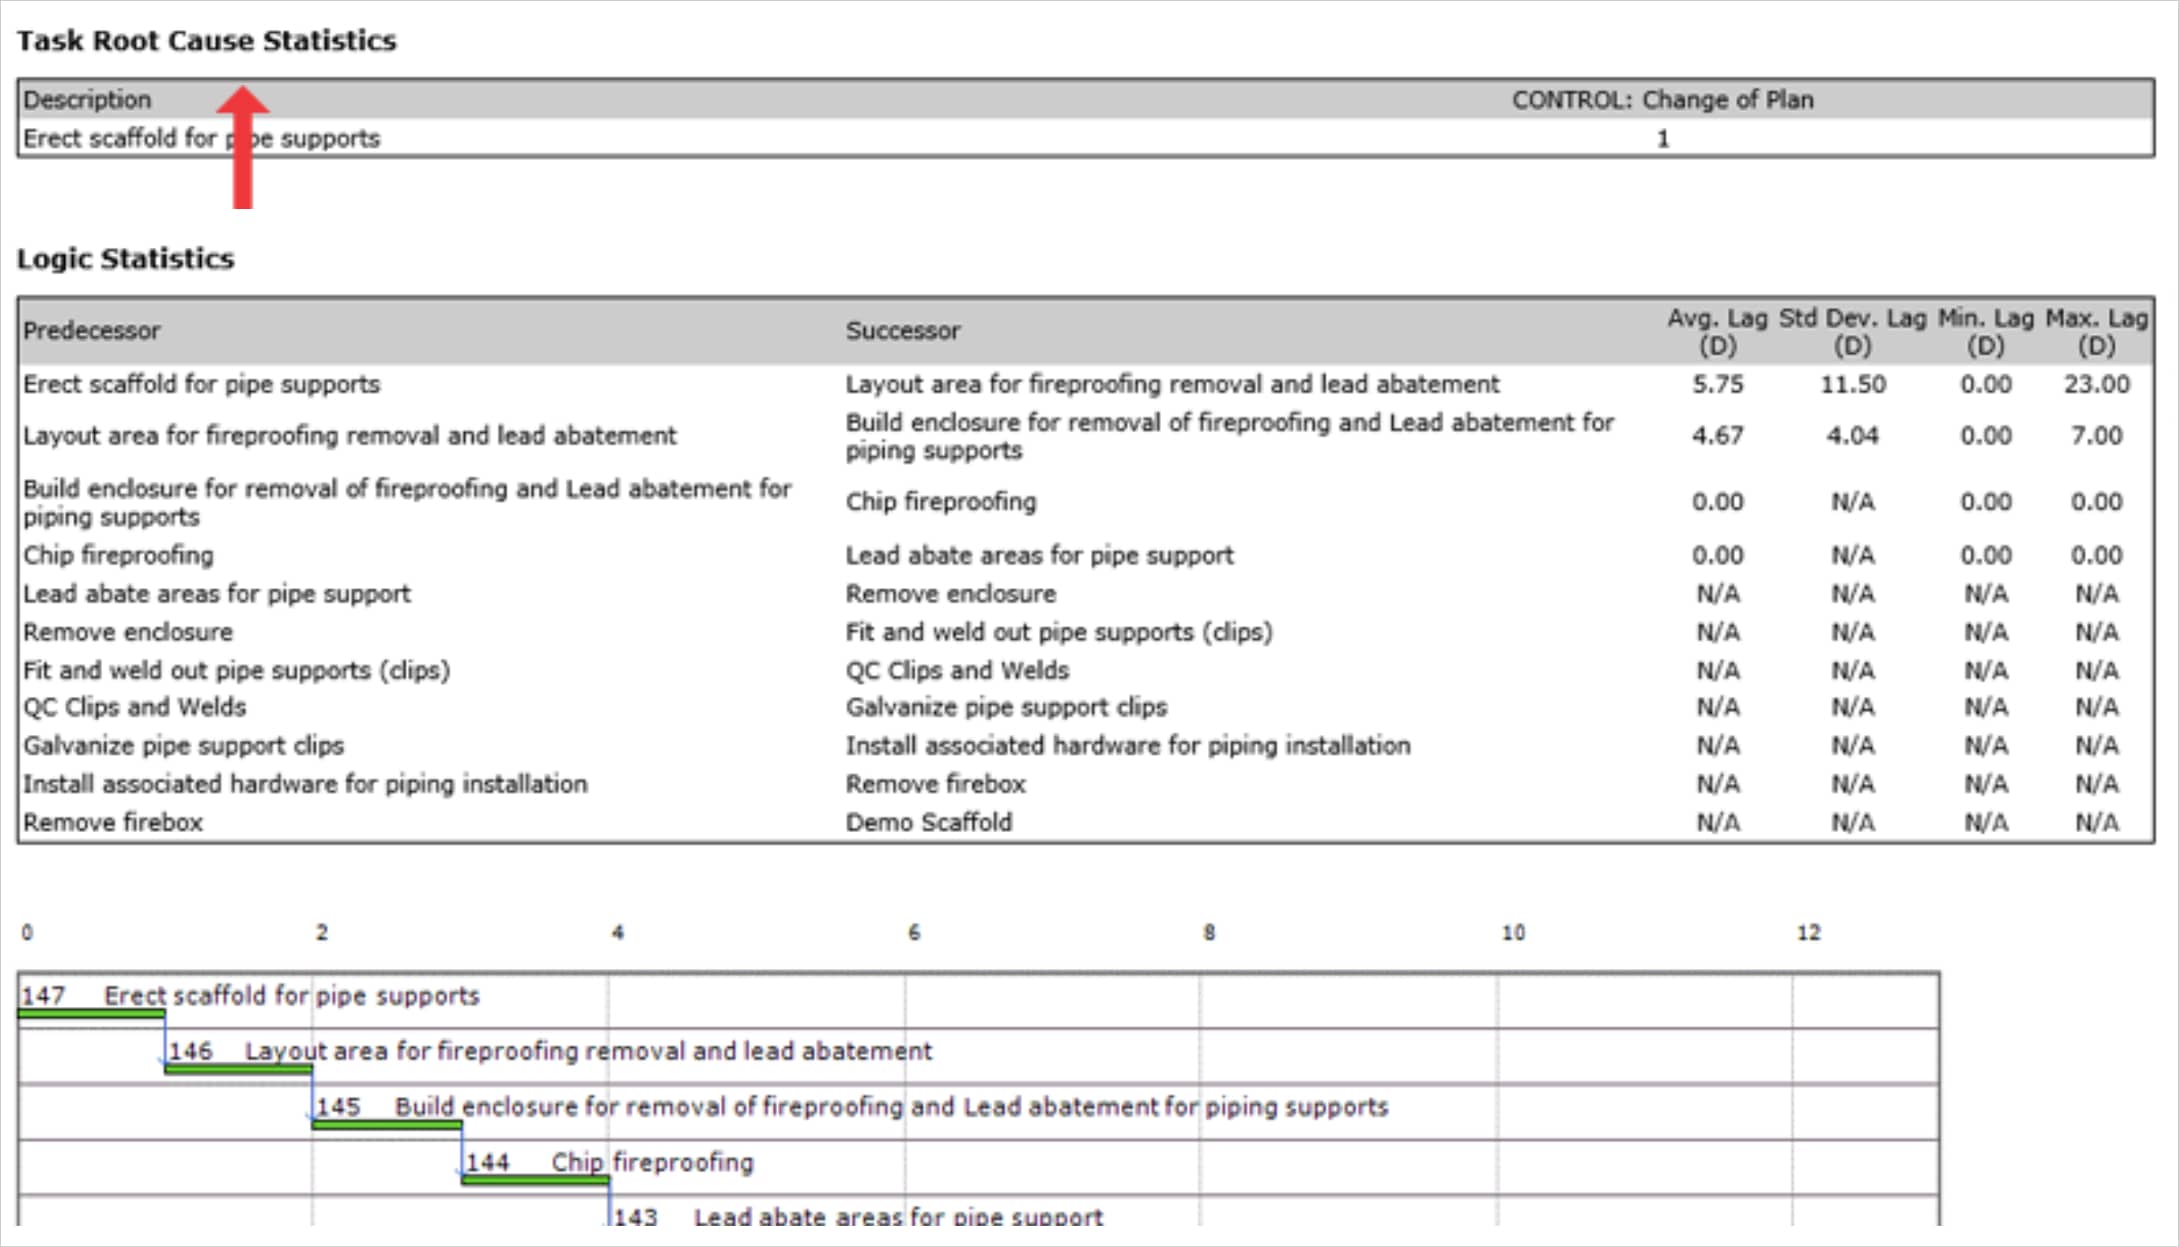
The Task Root Cause Statistics table introduces an analysis of what caused tasks in the standard process to not be completed as planned. This table lists the standard process steps vertically and reasons categories horizontally. Values shown on the table are the number of occurrences.
The Logic Statistics table introduces an analysis of predecessor-successor tasks for the selected standard process including the number of days of lag between completing the predecessor and starting the successor task. Statistical analysis for all lag values is also provided (standard deviation and min / max values).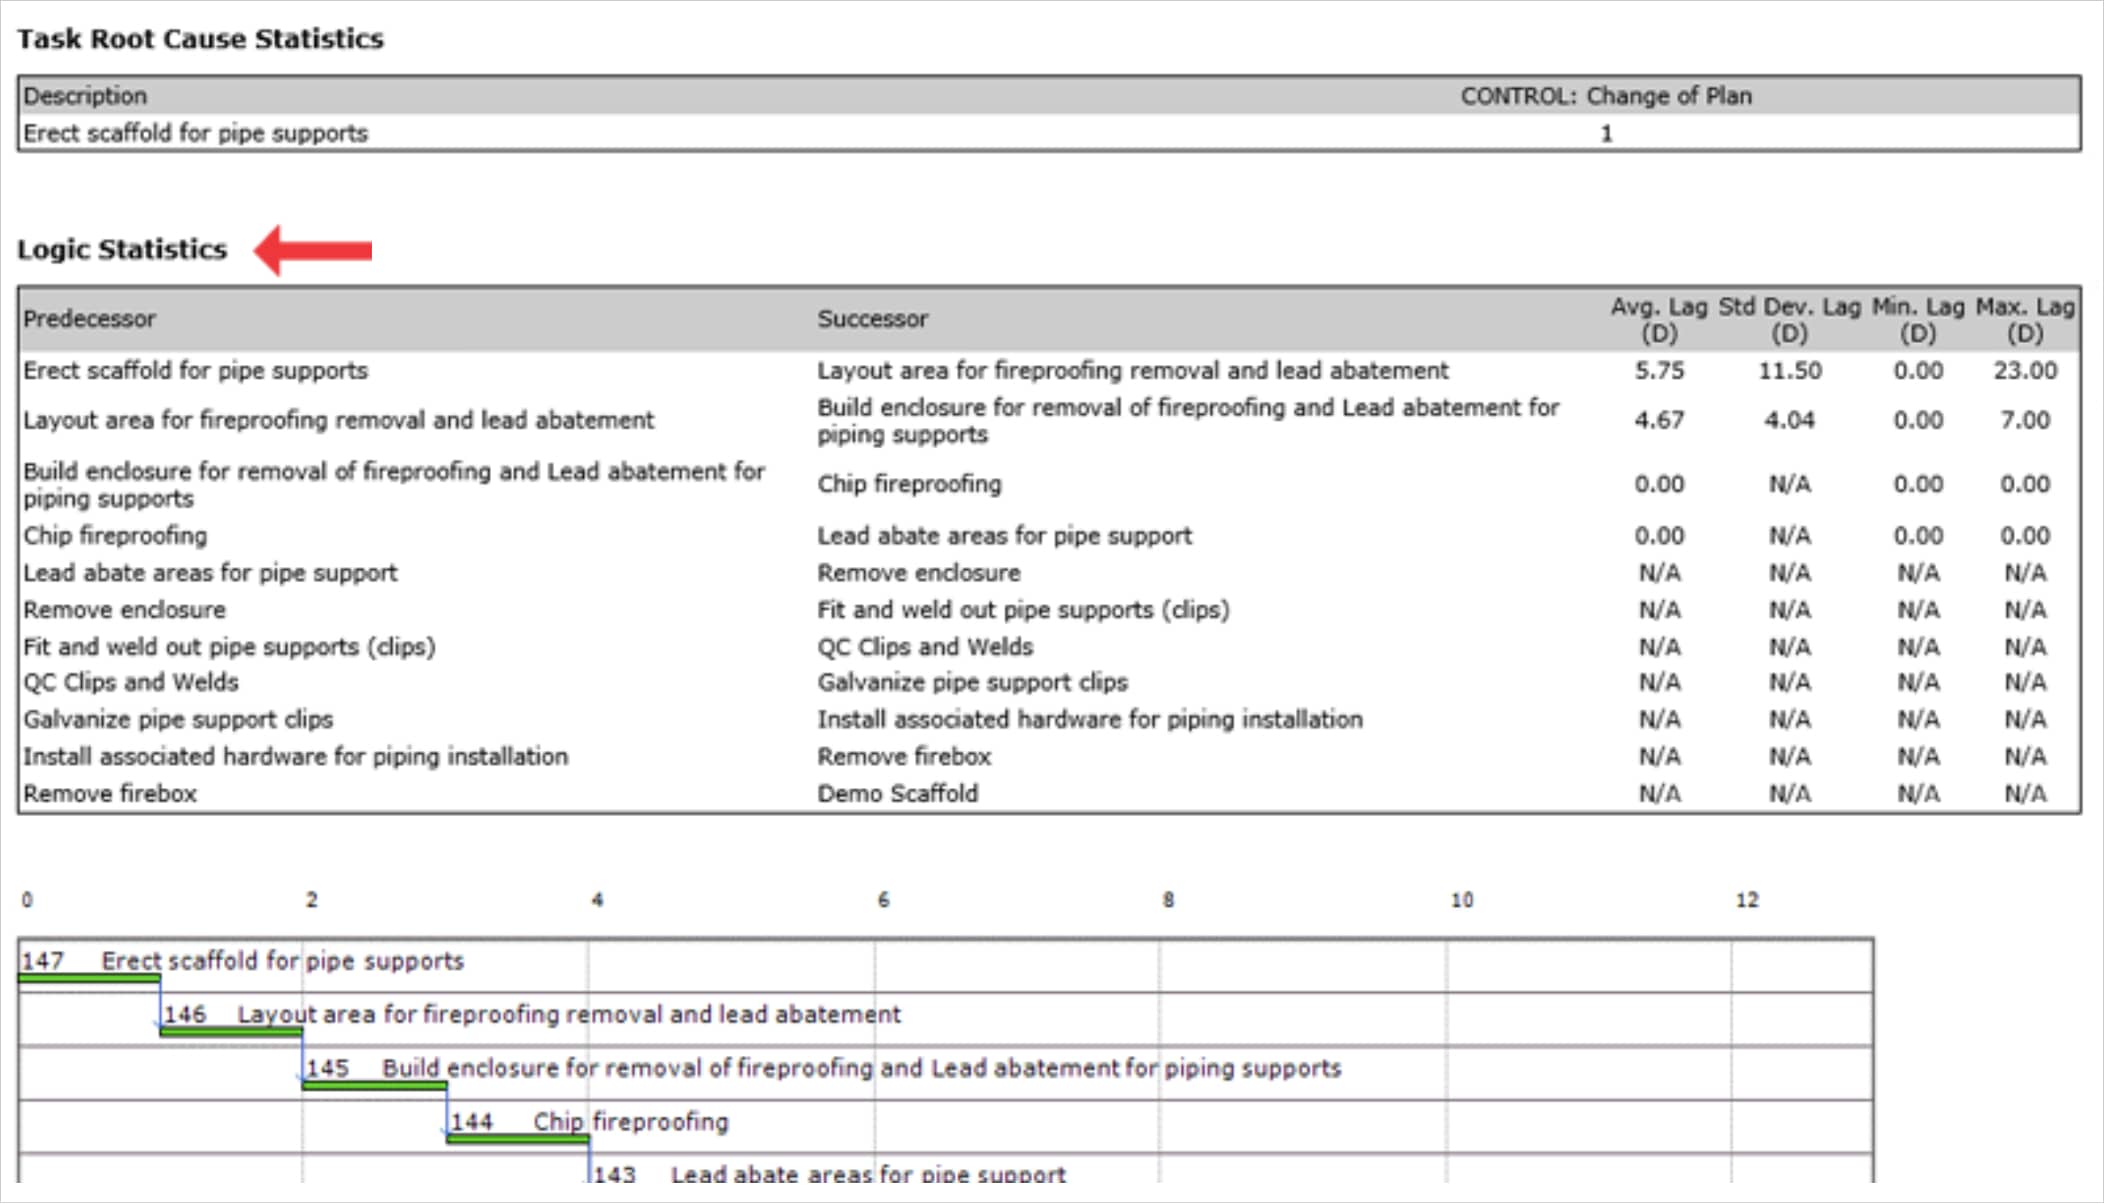
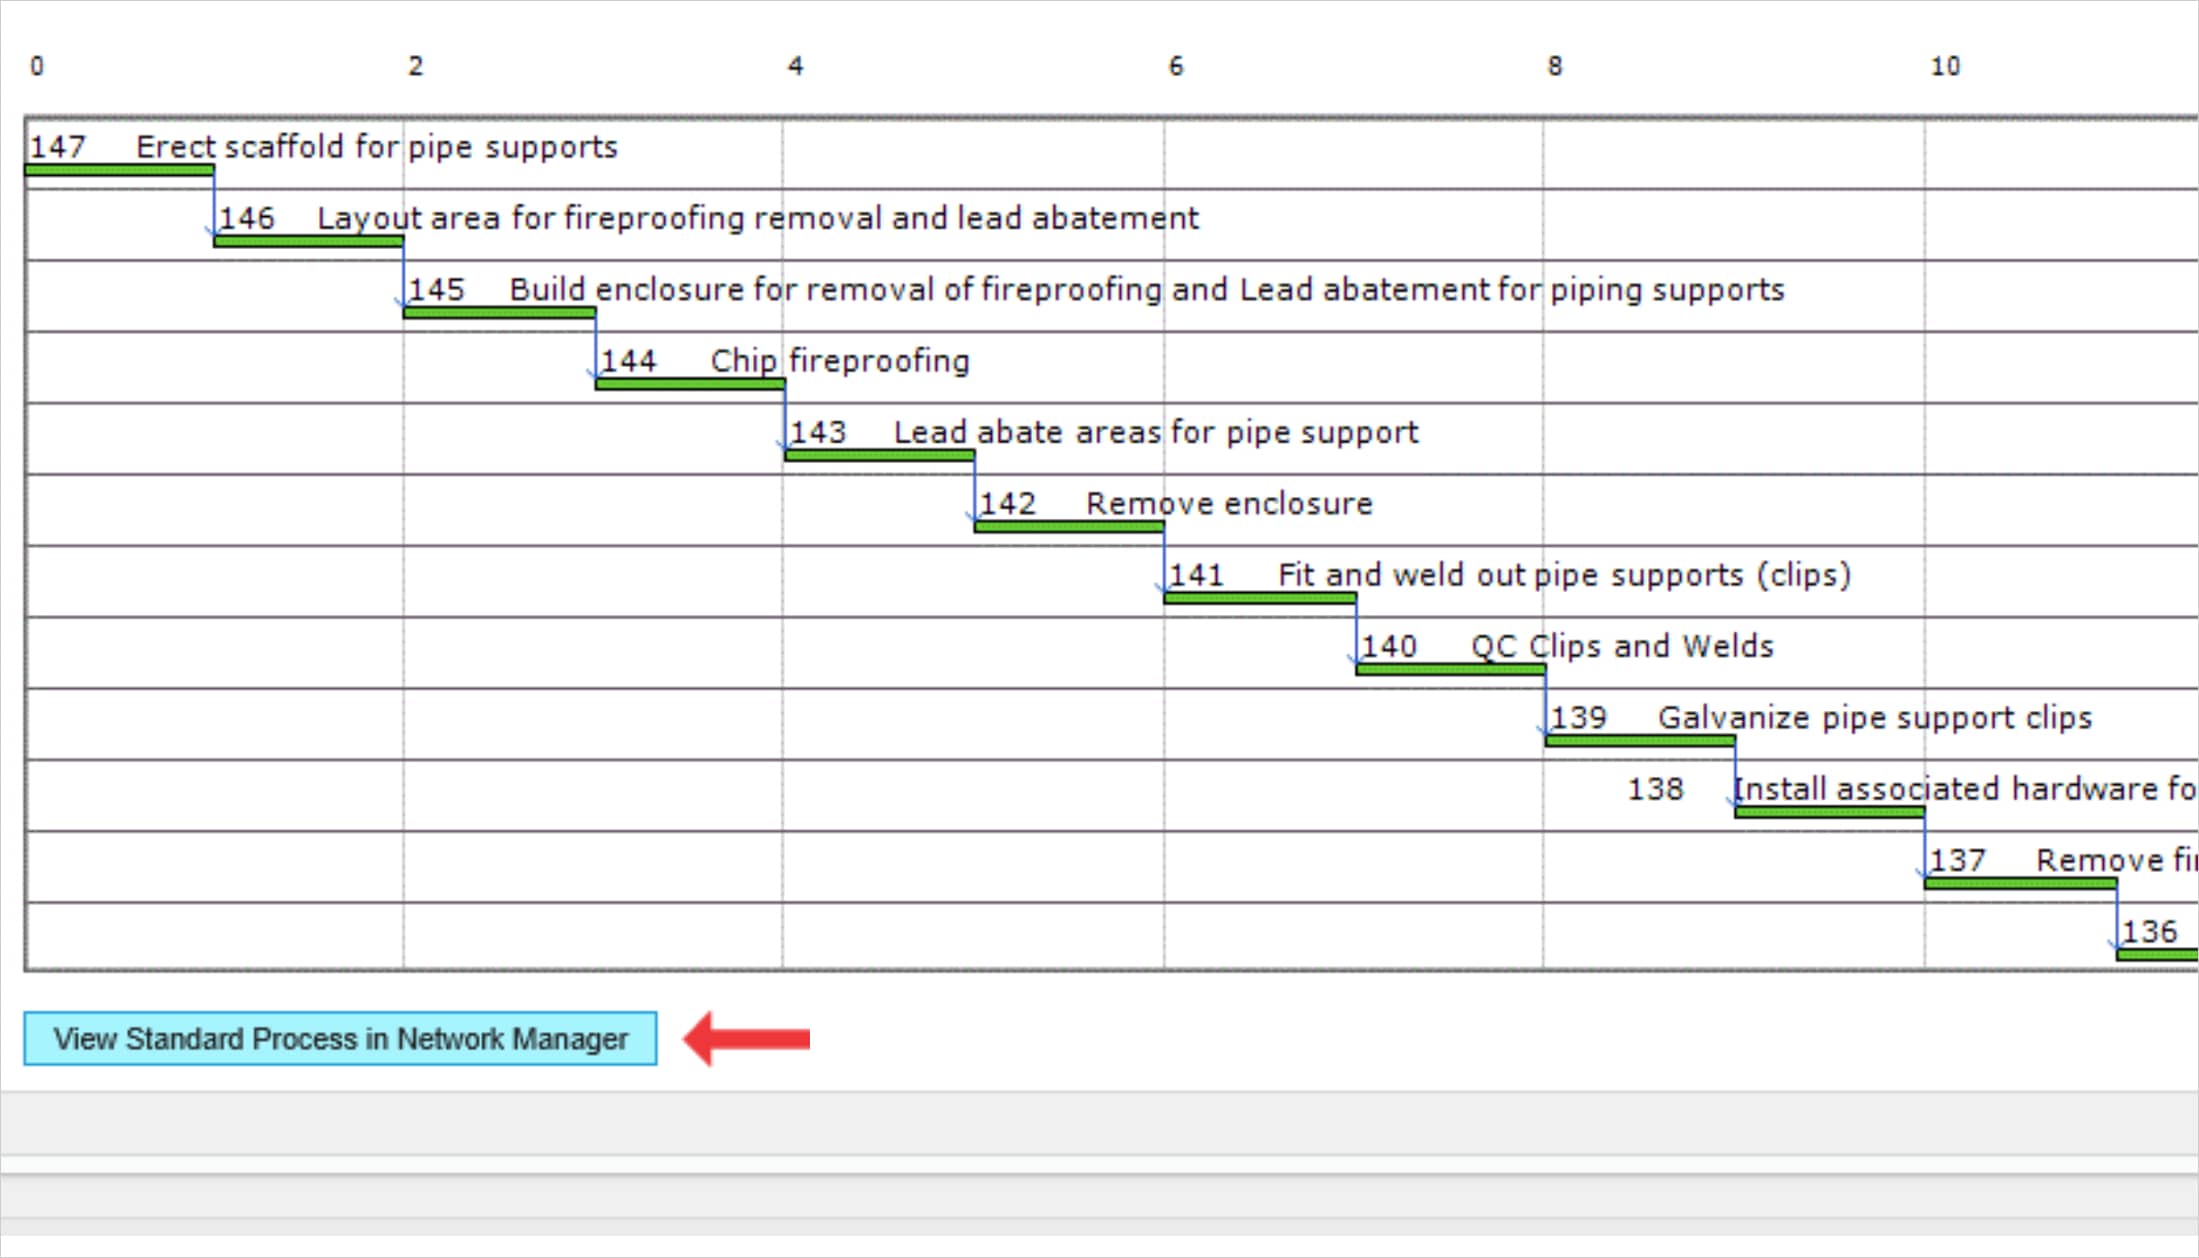
The Gantt Chart view displays the standard process along with corresponding durations for each step in a Gantt view.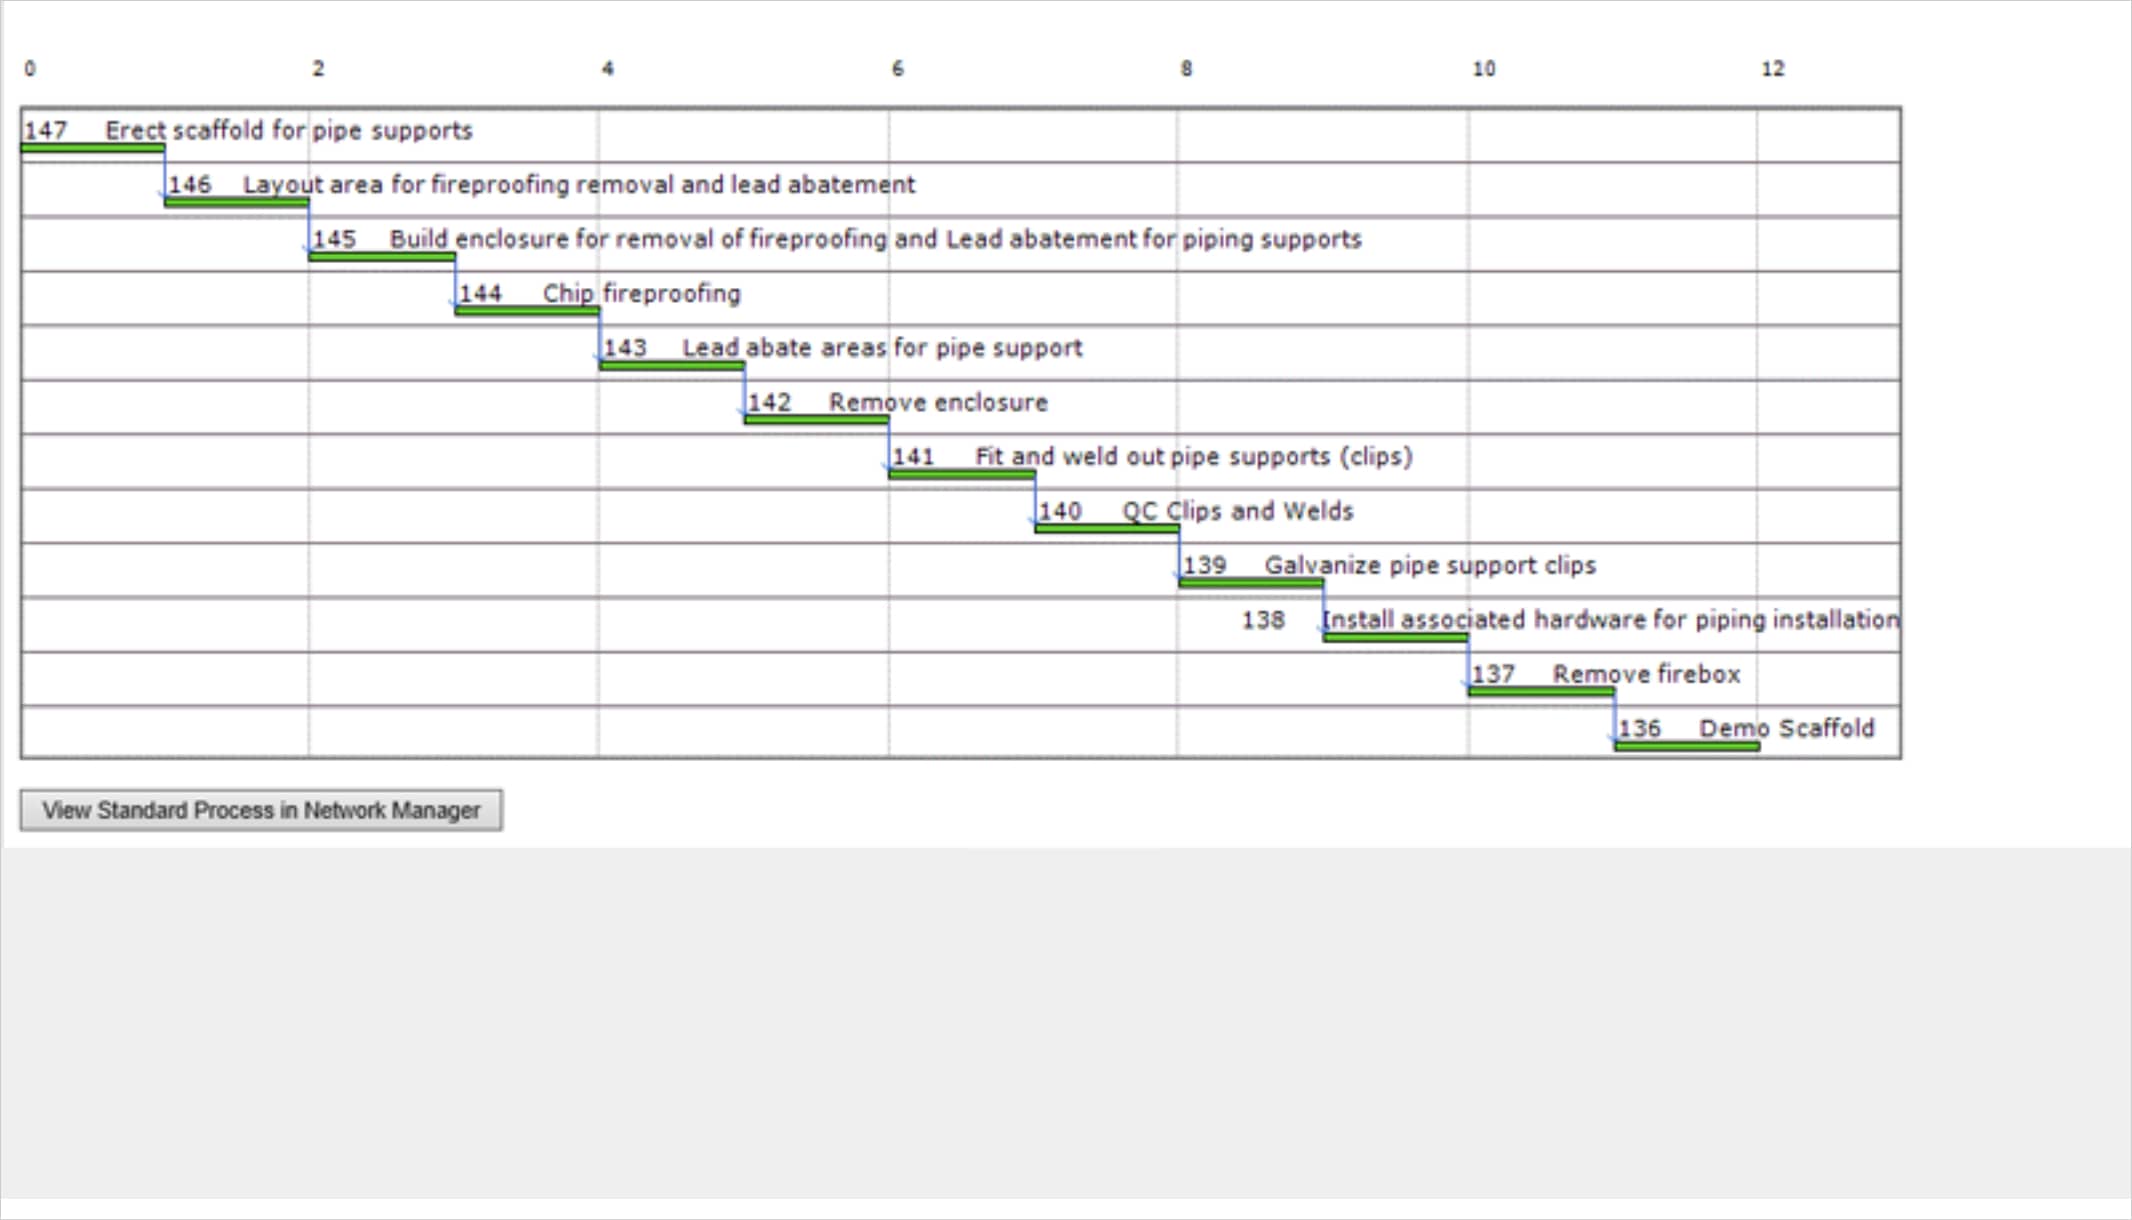
- For an alternate view of the standard process, click the View Standard Process in Network Manager button.
See Edit Existing Standard Process within Production Scheduling for information on how to use the Network Manager view.