
Understanding how optimizing process design, reducing variability and effectively using resources (capacity, inventory, and time) impact project objectives is critical for Performance Improvement. To assess this impact, Schedule Variance Status provides the average of actual values of schedule variance associated with only completed Milestones / Tasks for a given period of time.
In contrast with Schedule Variance which looks at only Master Level Milestones and provides a forecast completion per Master Level Milestone, Schedule Variance Status does not provide a forecast, but rather an actual record of how schedule variance has changed over time by plotting the average schedule variance for all completed tasks within the selected period.
To access Schedule Variance Status, complete the steps below:
- From the Main Navigation Bar select Analytics, then select Schedule Variance Status.
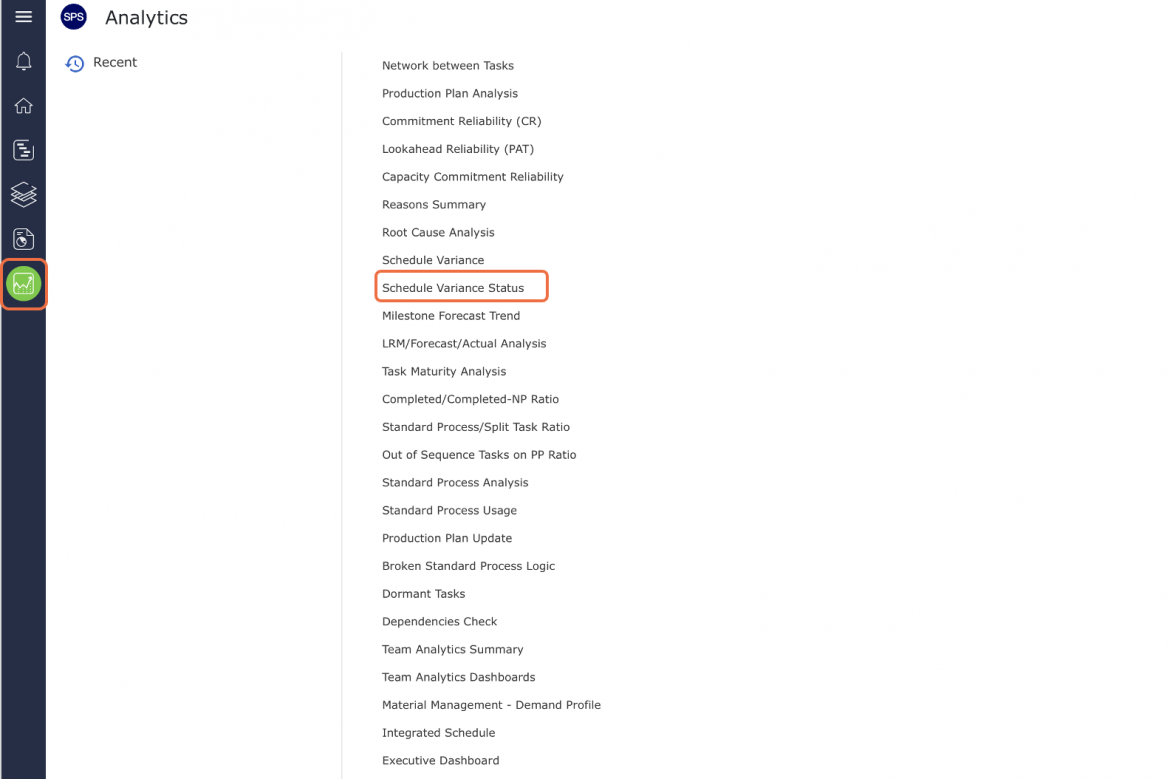
- Schedule Variance opens in a new window and automatically displays the Analytic for the team selected under the Team Menu with the default date range of four weeks from the current date.
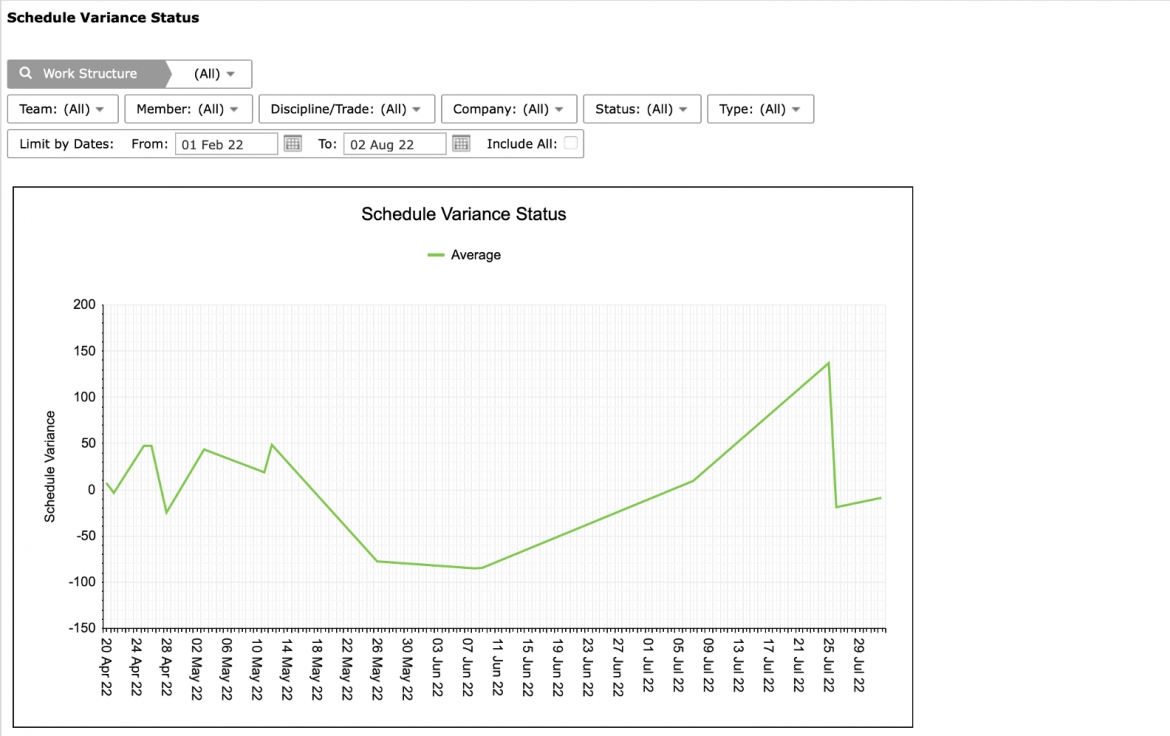
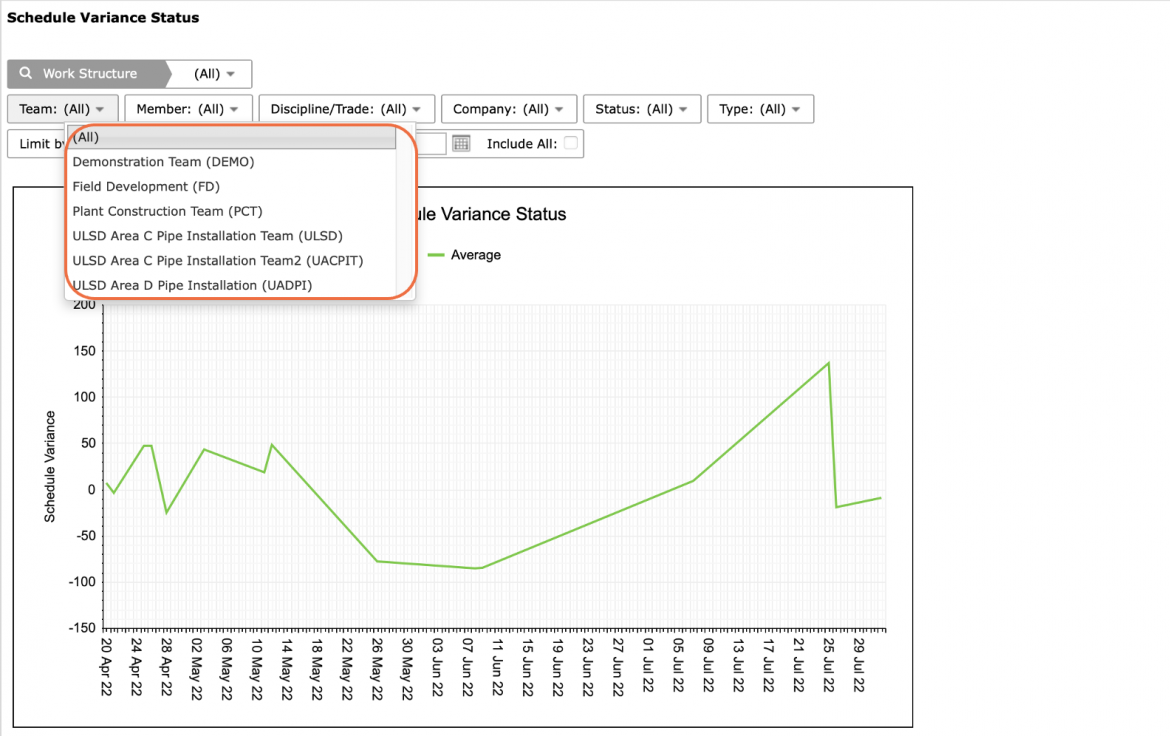
- To view Schedule Variance Status for another team, select the desired team under the Team drop-down.
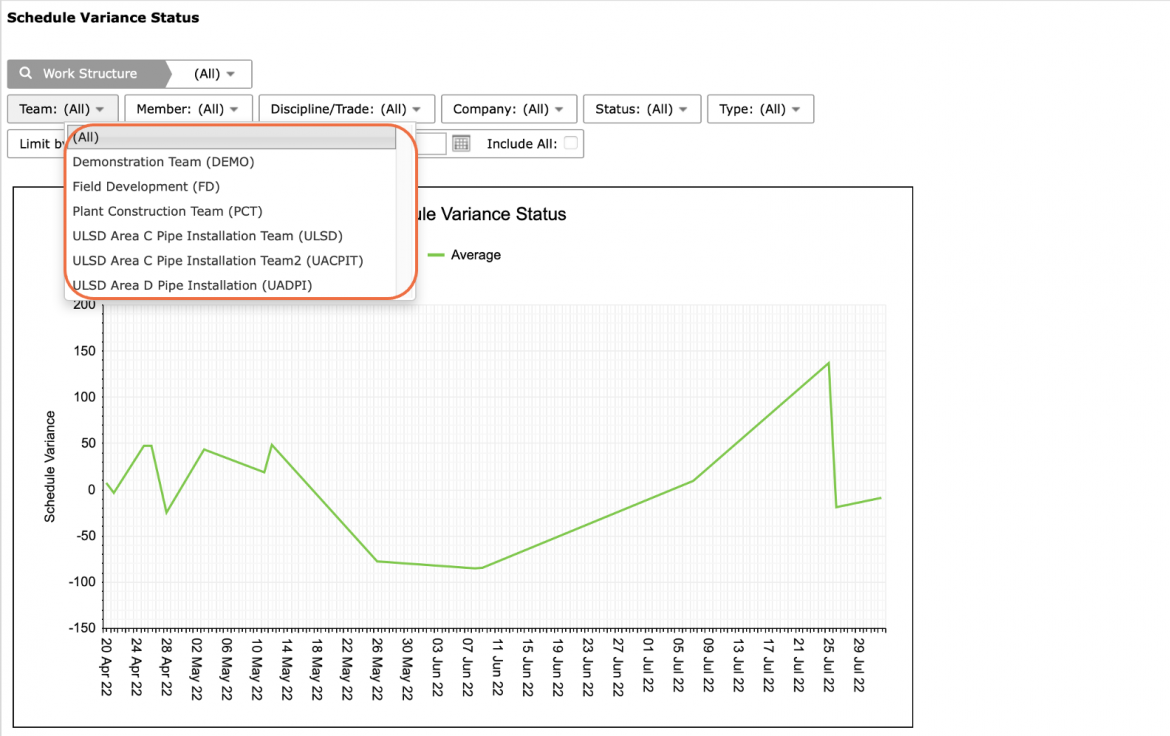
- If a different date range is desired, or no data is visible, adjust the From date, or check: Include All, to show all historical data.
- Also use the Pin icon in the top right of the graph to include Schedule Variance Status in your Dashboard.
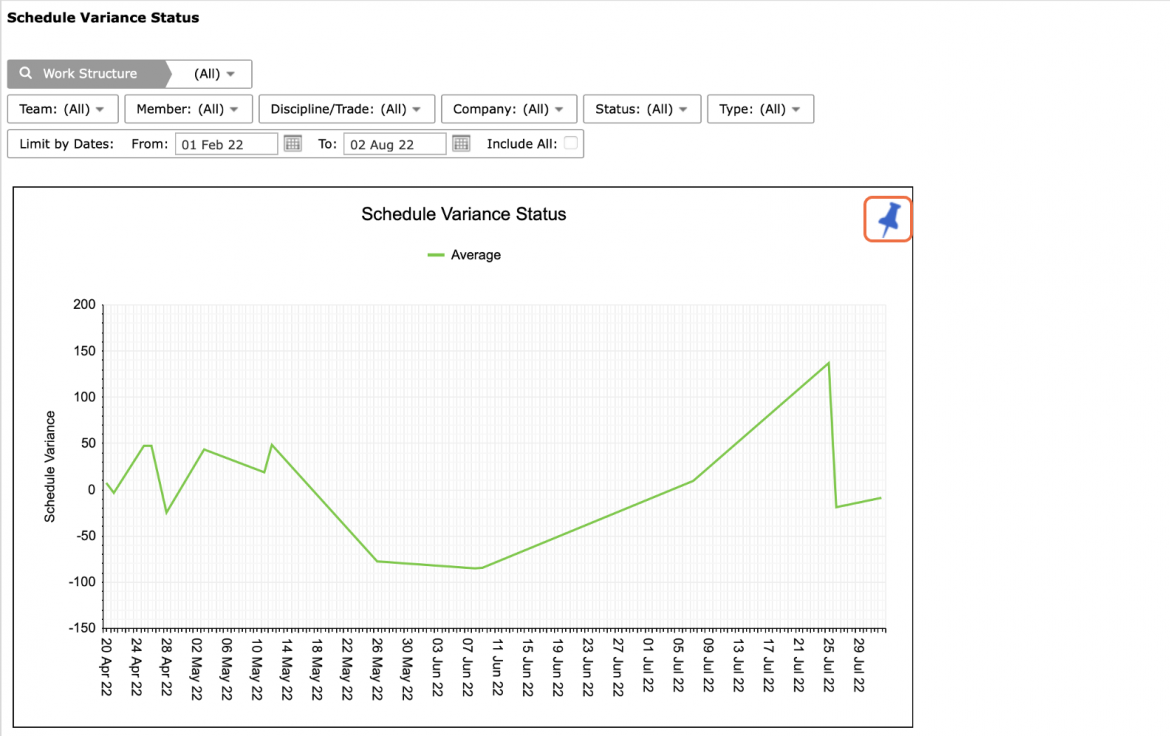
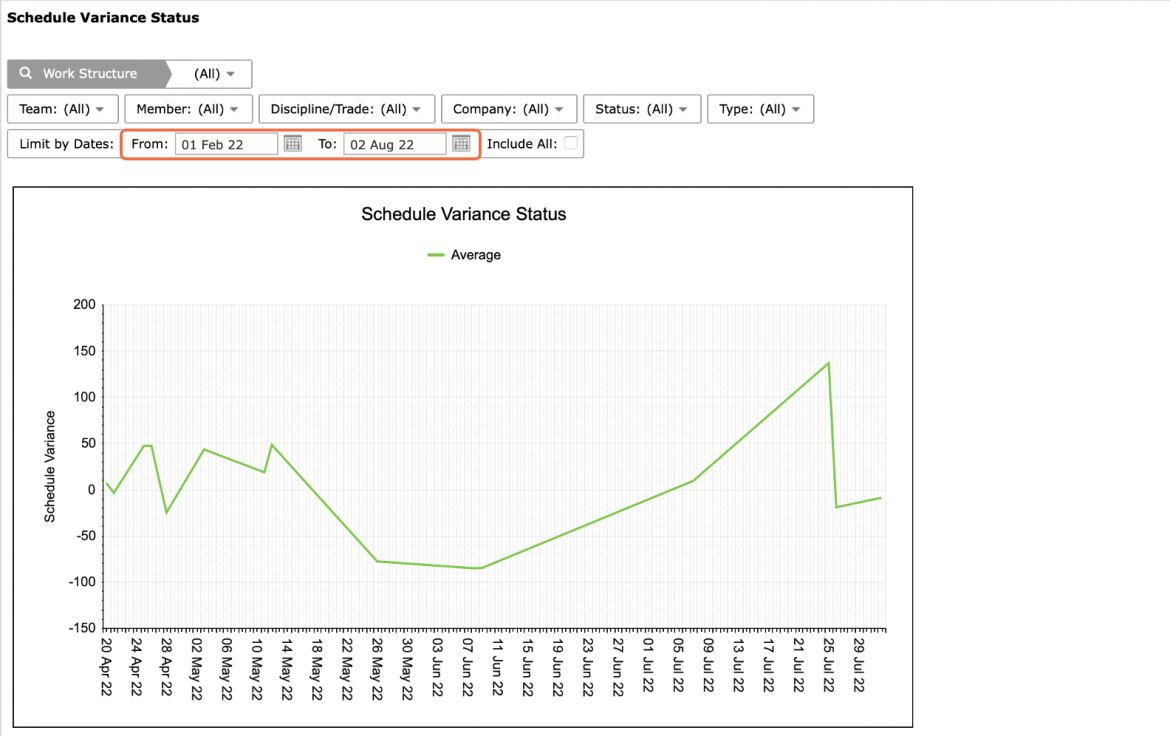
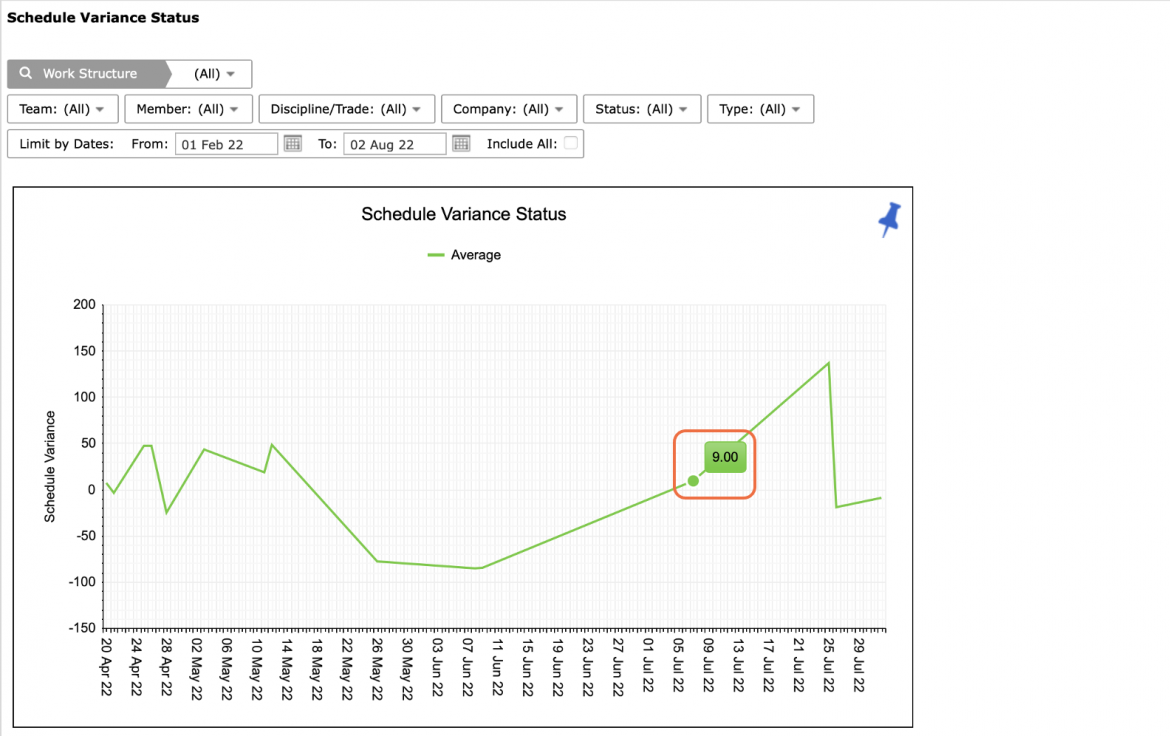
- For the selected team(s), Schedule Variance Status displays a line graph across time of how the schedule variance has changed over time plotting the average schedule variance for all completed tasks within the selected period. Each data point on the graph represents the aggregate schedule variance for all completed tasks.
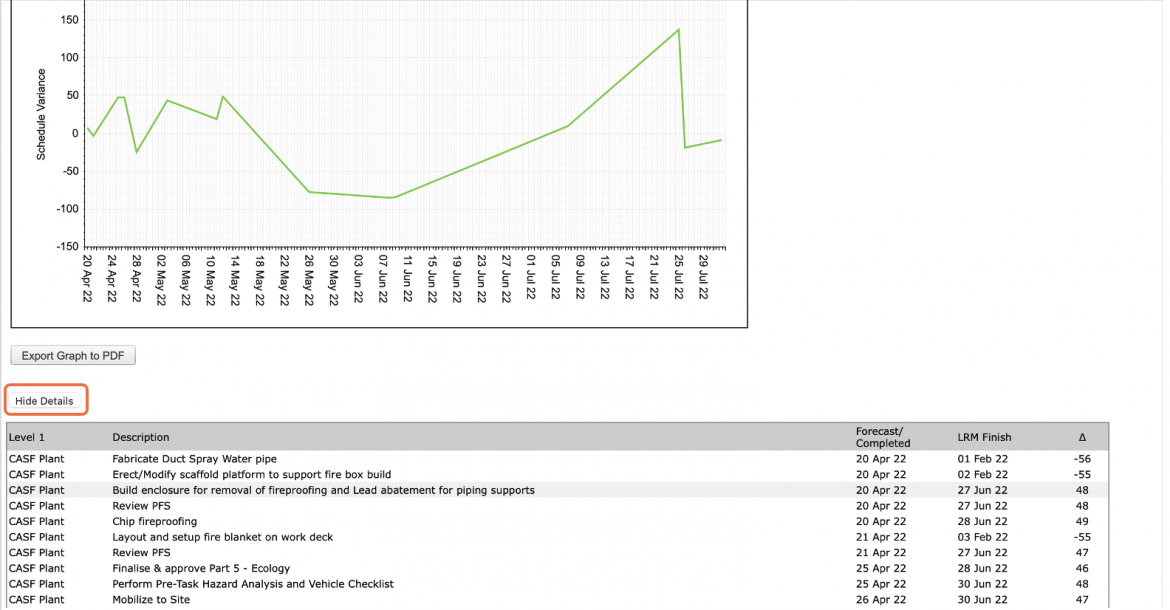
- To view the data behind the Schedule Variance calculation for each Master Level Milestone, click: Show Details, beneath the graph. To hide the data, click Hide Details.
For each individual Master Level Milestone, the data table lists the Forecast / Completed, LRM Finish, and schedule variance.
- In addition to viewing Schedule Variance Status for a single team, to view an aggregate Schedule Variance Status for all teams, select: All, under the Team drop-down.
This feature displays the average schedule variance for all completed tasks for all teams to show global delivery issues across the project.
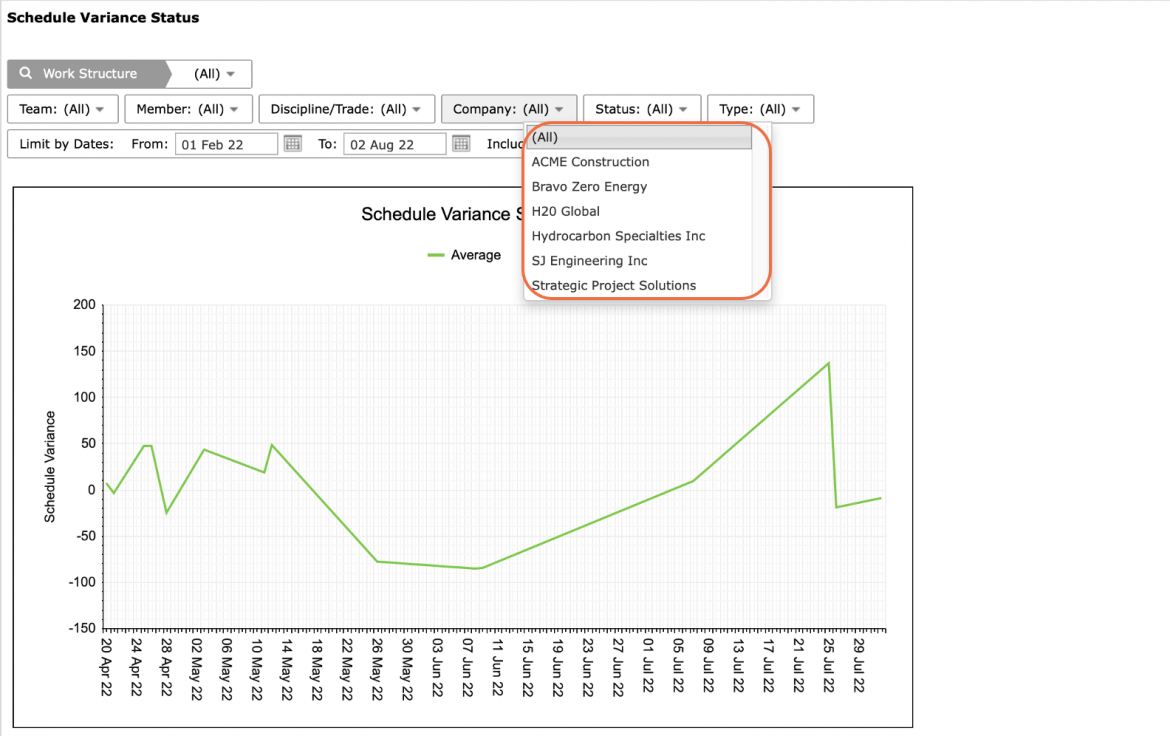
- You can also filter by Member, Company, Discipline / Trade, Work Structure and Status.
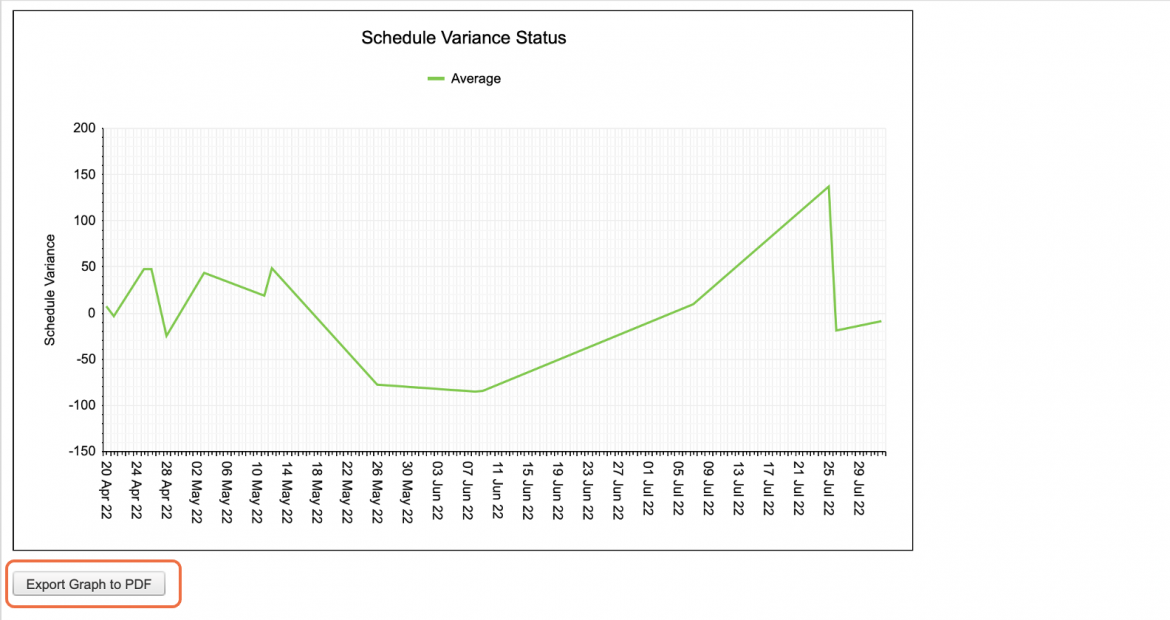
- To export Schedule Variance Status to a PDF file, click the Export Graph to PDF button and follow the prompts according to the specific browser you are using.
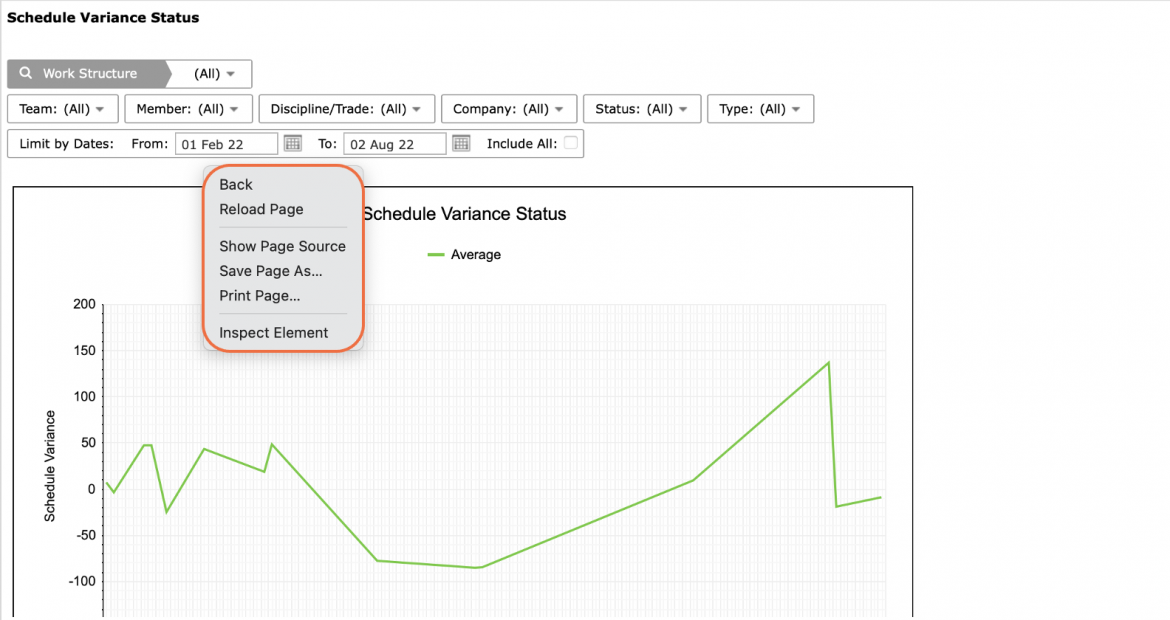
- To print Schedule Variance Status, options may differ based on your browser. For instance, if you are using Internet Explorer, right-click in the white space outside of the Commitment Reliability graph and select Print from the menu or simultaneously press the Ctrl and P keys on your keyboard.
- The Print Dialogue box opens.
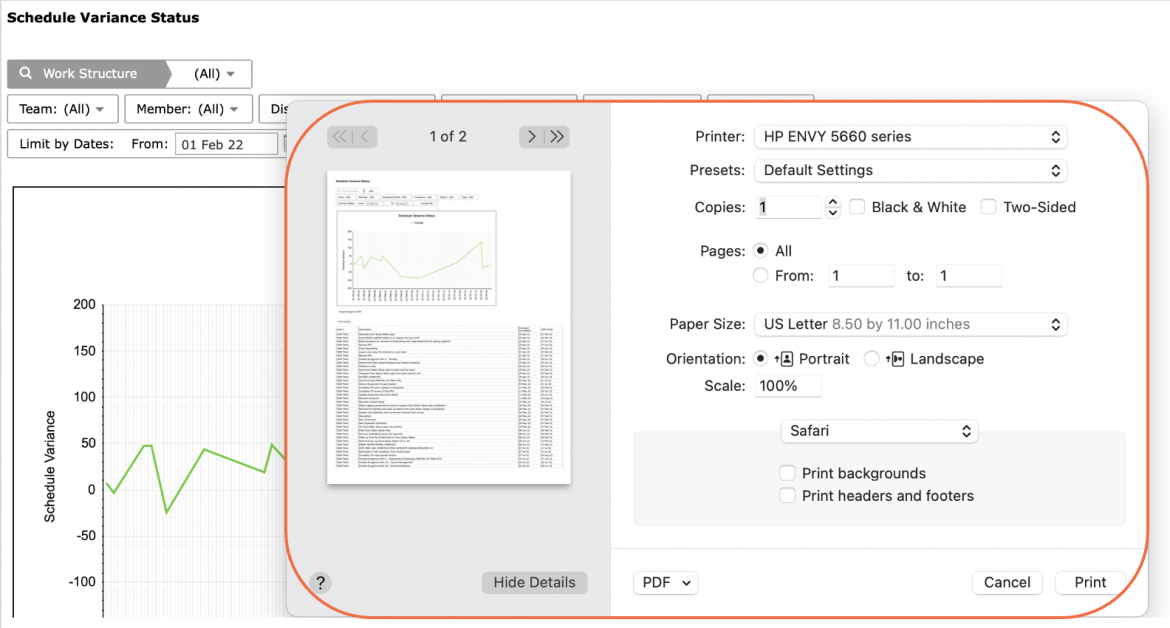
- Using the Print Dialogue box, change any desired print settings. Once all relevant printing settings have been modified, click the Print button.
Note: Before printing, it is recommended you confirm the fit to the desired paper size.