
As variability increases, so do the size of capacity (people, equipment, and space), inventory (materials stocks, completed work, etc.), and time (cycle and lead) buffers. Unnecessary buffers have a negative impact on project costs and schedules. Increasing reliability enables better utilization of existing capacity and cycle time reduction, which allows the elimination of unnecessary buffers.
Commitment Reliability (CR) indicates how reliable a team is when committing to execute work for a given Planning Horizon. It does this by comparing tasks committed on a Production Plan against tasks actually completed. Commitment Reliability indicates how much variability a team is exposed to, but it does not quantify variability.
To generate the Analytic, the creation and updating of Production Plans are needed. CR is measured every time the status of a Production Plan is updated, followed by closing out the plan. It is calculated based on the formula below.

For example, if a Production Plan included a total of 10 tasks and only 5 tasks were completed as planned, CR is 50%. If average commitment reliability is ~100%, the team should analyze Capacity Commitment Reliability to determine if labor capacity is effectively used during each Planning Horizon e.g., day or week to ensure that workflows are as planned.
If average commitment reliability is not ~100%, the project team should analyze Reasons Summary and Root Cause Analysis to determine and eliminate the source(s) of variability to the optimal extent possible.
To access Commitment Reliability, complete the steps below:
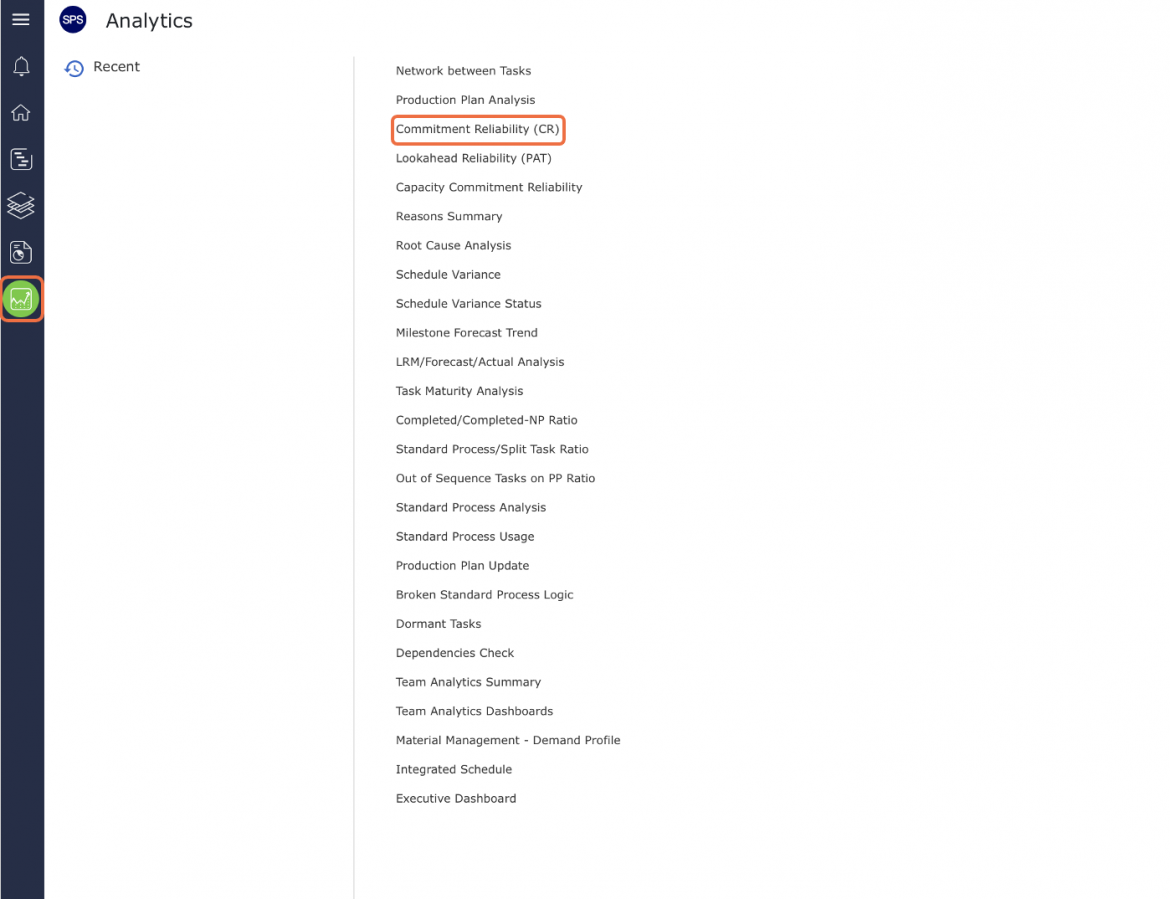
- From the Main Navigation Bar select Analytics then select Commitment Reliability.
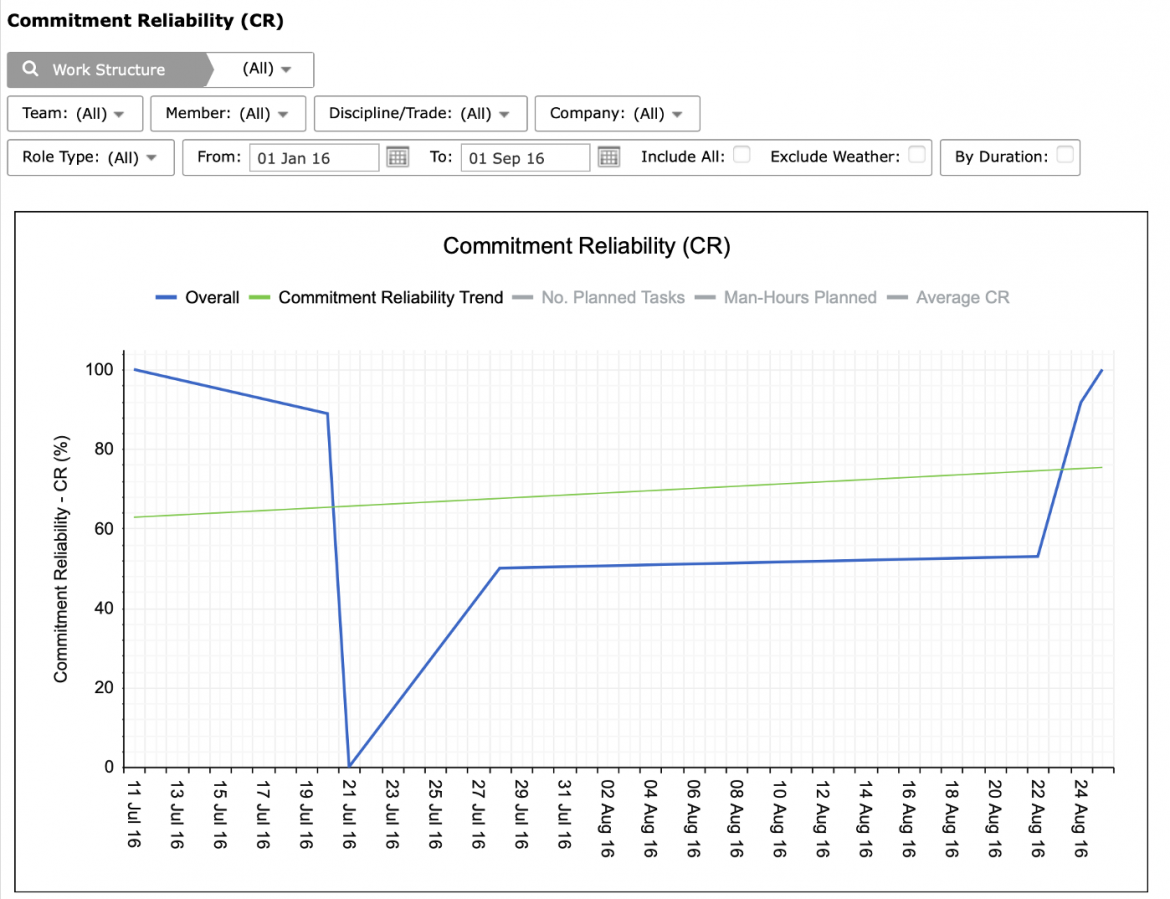
- Commitment Reliability opens in a new window and automatically displays the Analytic for the team selected under the Team Menu with the default date range of two weeks from the current date.
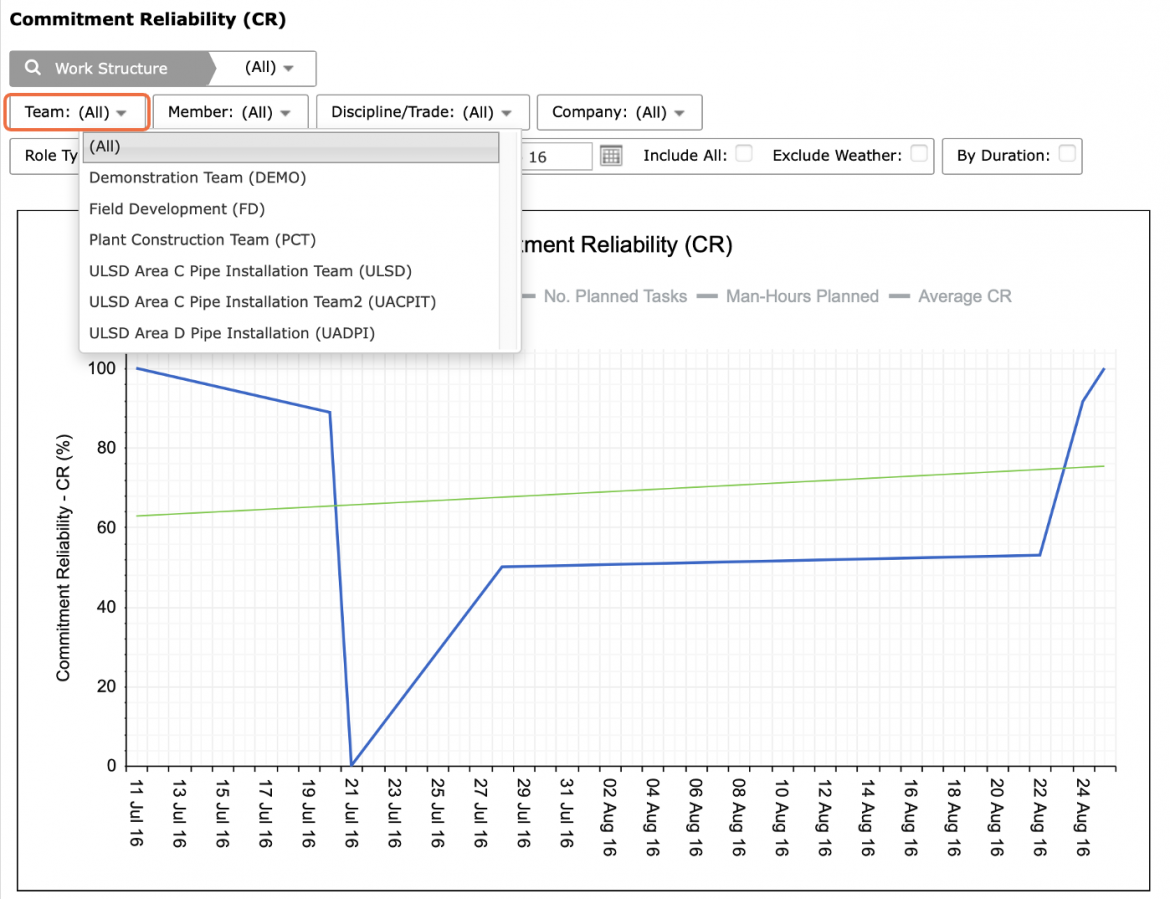
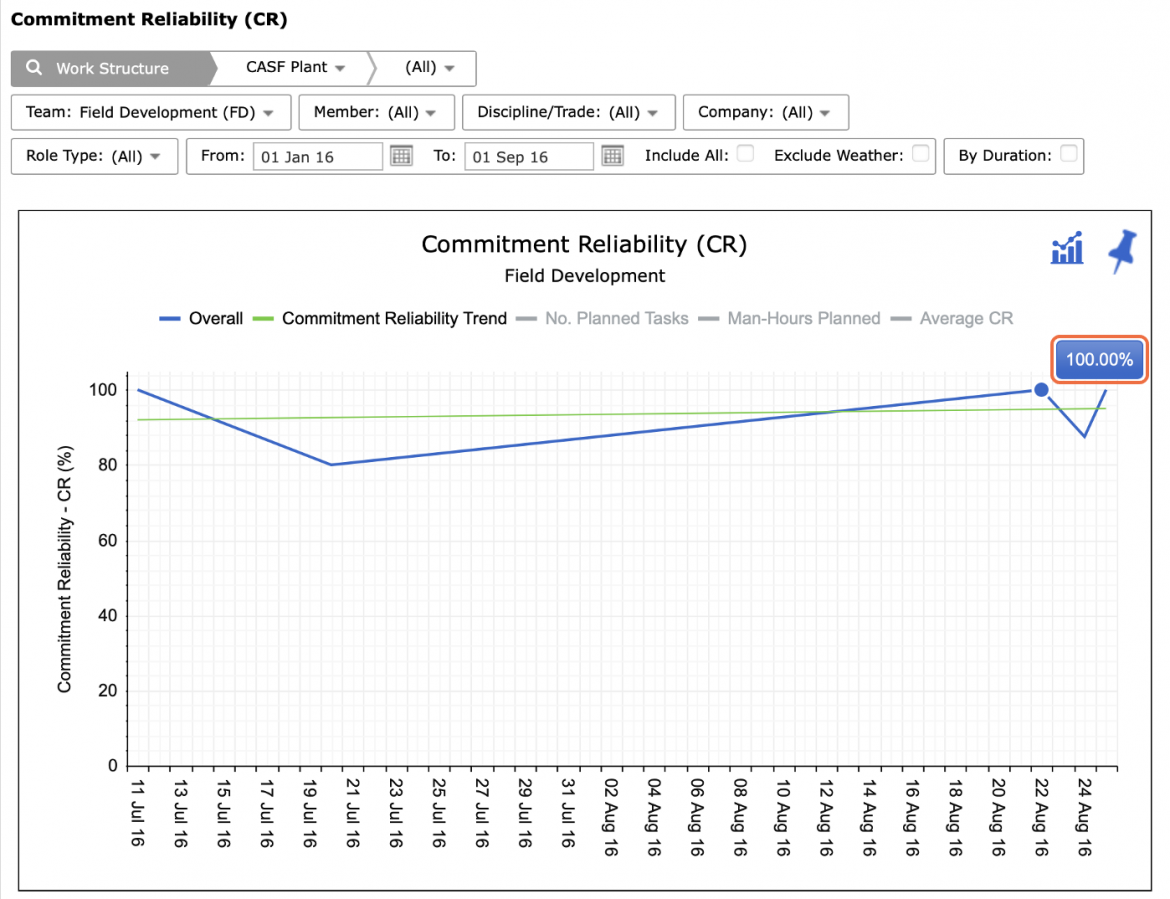
- To view Commitment Reliability for another team, select the desired team under the Team drop-down.
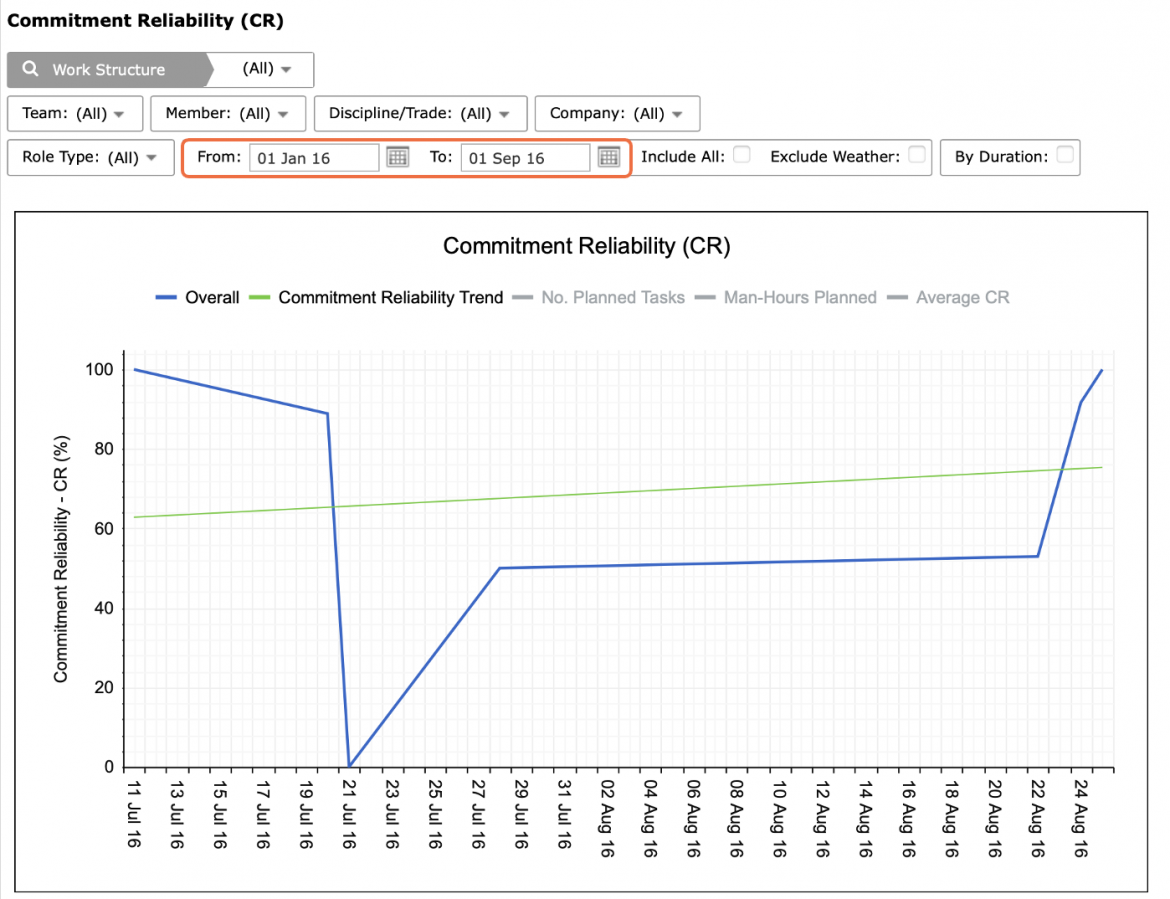
- If a different date range is desired, or no data is visible, adjust the From and To dates, or check Include All to show all historical data.
All legend elements, Overall, Commitment Reliability Trend and No. Planned Tasks, are clickable and toggle to display / hide data.
- Also use the Pin icon in the top right of the graph to include Commitment Reliability in your Workbench.
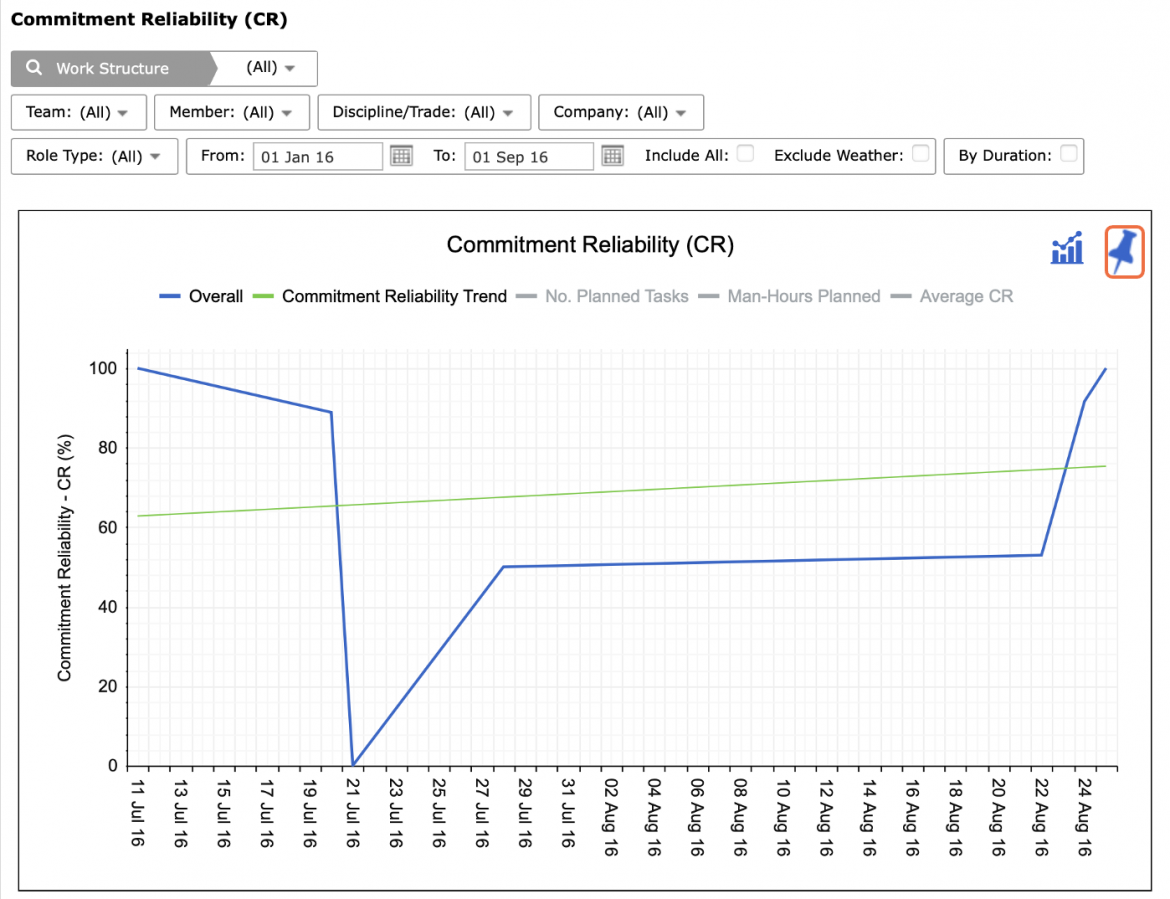
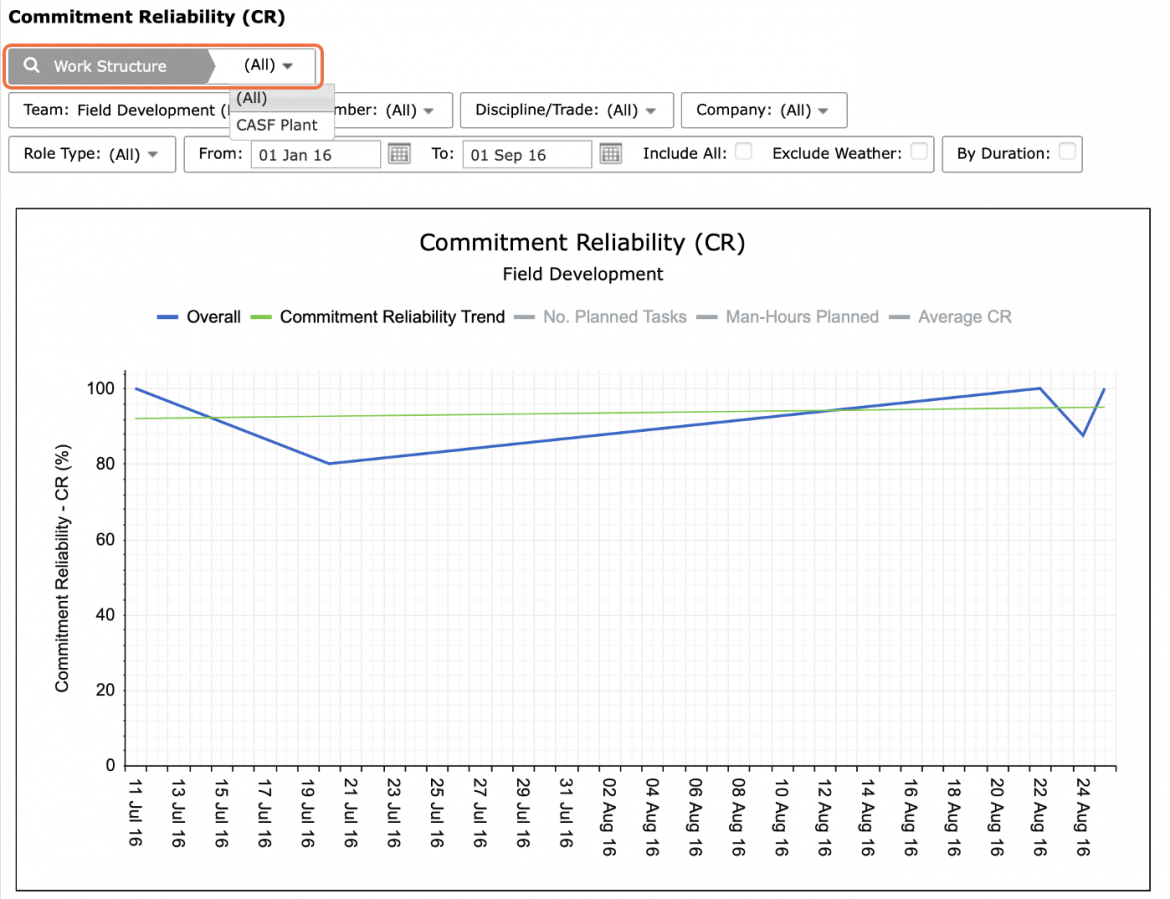
- For the selected team(s), Commitment Reliability displays a line graph across time, allowing analysis of trends in workflow reliability. Each data point on the graph represents the CR for an individual Production Plan.
A target of 100% capacity utilization should not be considered. 20% capacity buffer should be available to absorb any unforeseen variability, and thereby, increase the likelihood of achieving 100% reliability. Capacity utilization can be increased to 90% as work becomes more reliable (reduce the capacity buffer to 10% or less).
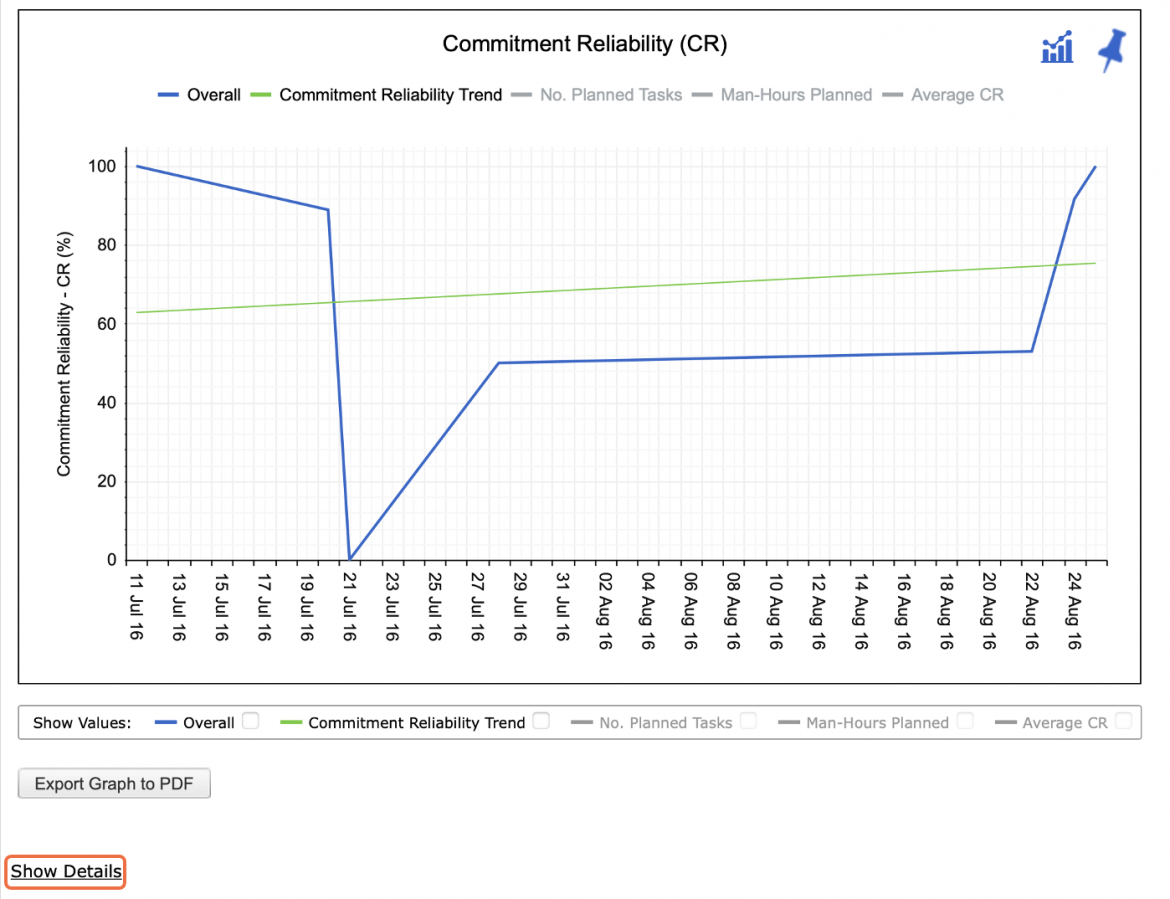
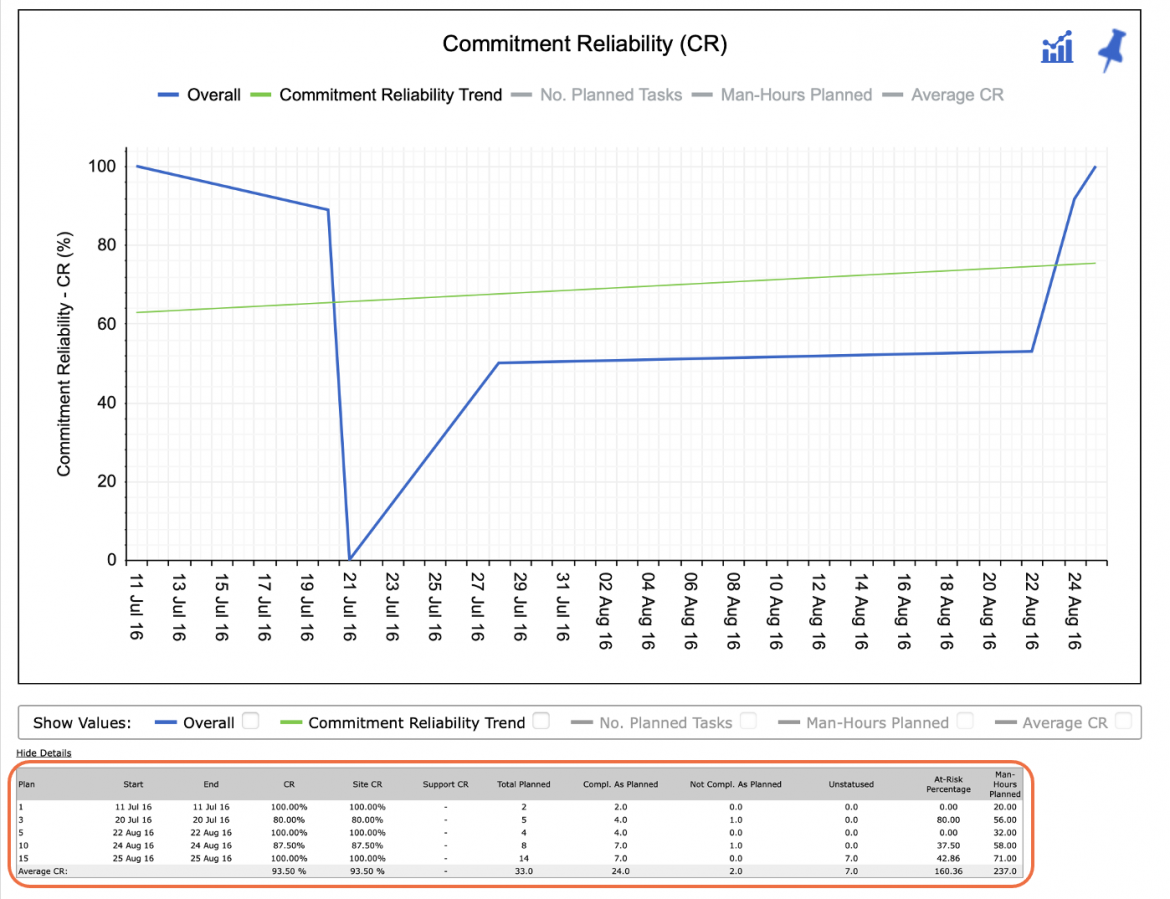
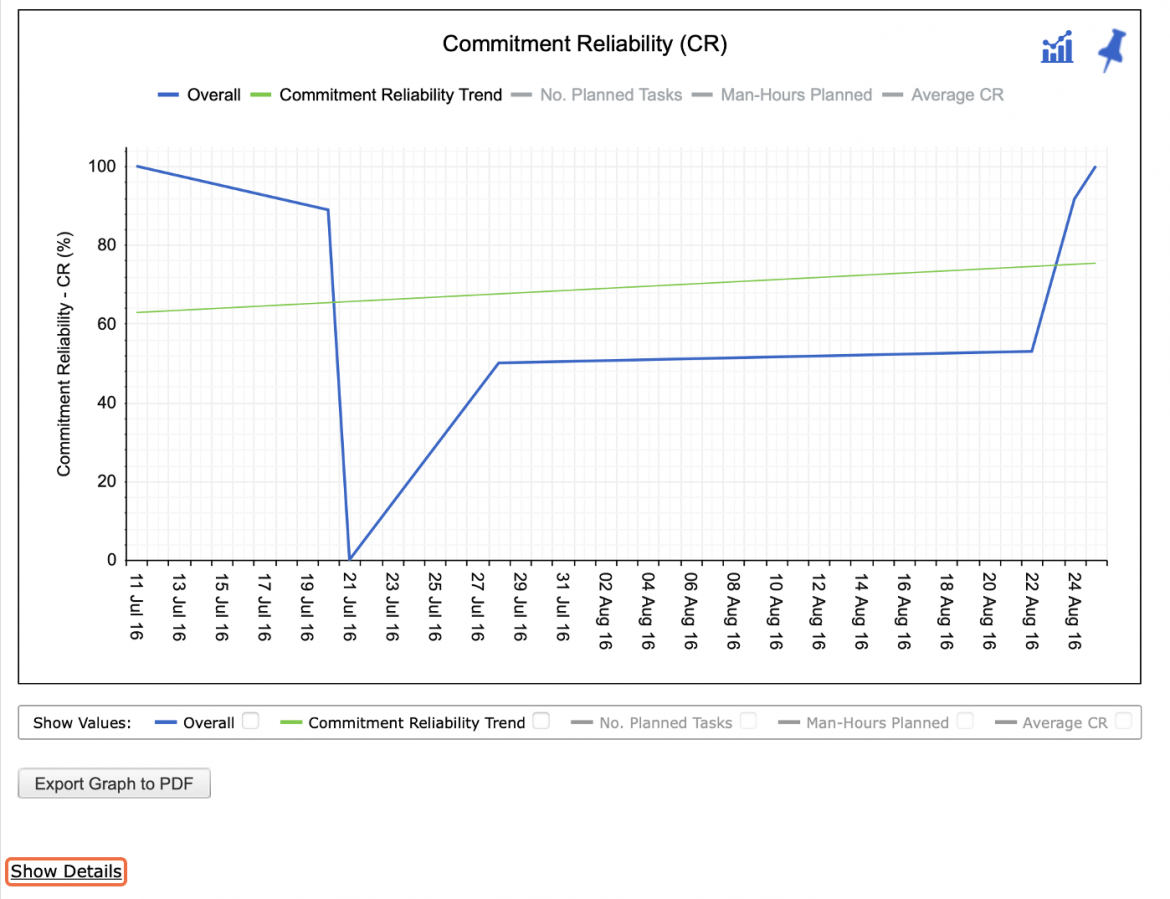
- To view the data behind the Commitment Reliability calculation for each Production Plan, click Show Details beneath the graph. To hide the data, click Hide Details.
For each individual Production Plan, the data table lists the start date and end date of the Plan, overall CR, CR for Support and Site tasks, total number of tasks loaded on the Plan, number of tasks completed as planned, number of non-completed tasks and number of unstatused tasks. The average CR is also shown at the bottom of the table.
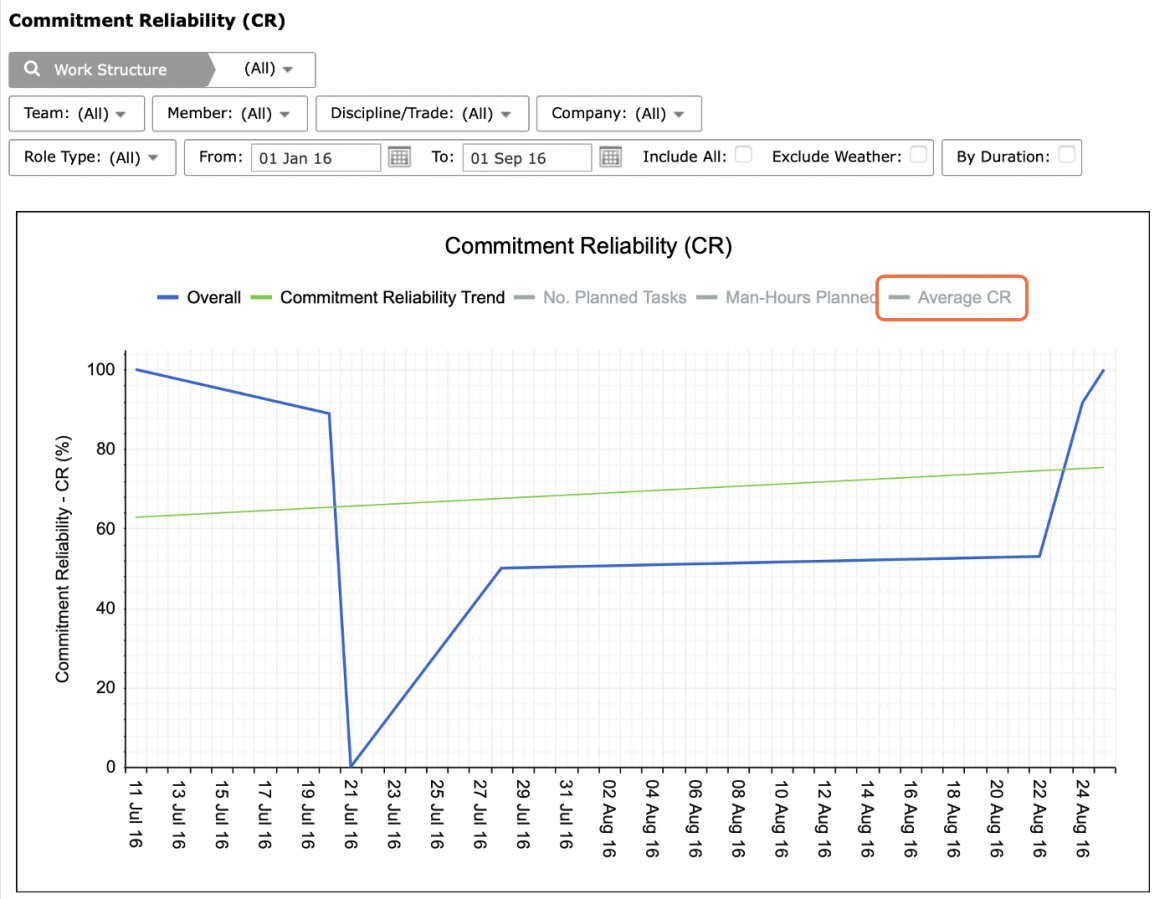
- When selecting any date range, users can elect to graphically display a line that represents the average Commitment Reliability value and quickly gain access to this information. For example, to display the Average CR line, select the ‘Average CR’ legend element at the top of the chart. You can display any combination of the legend elements.
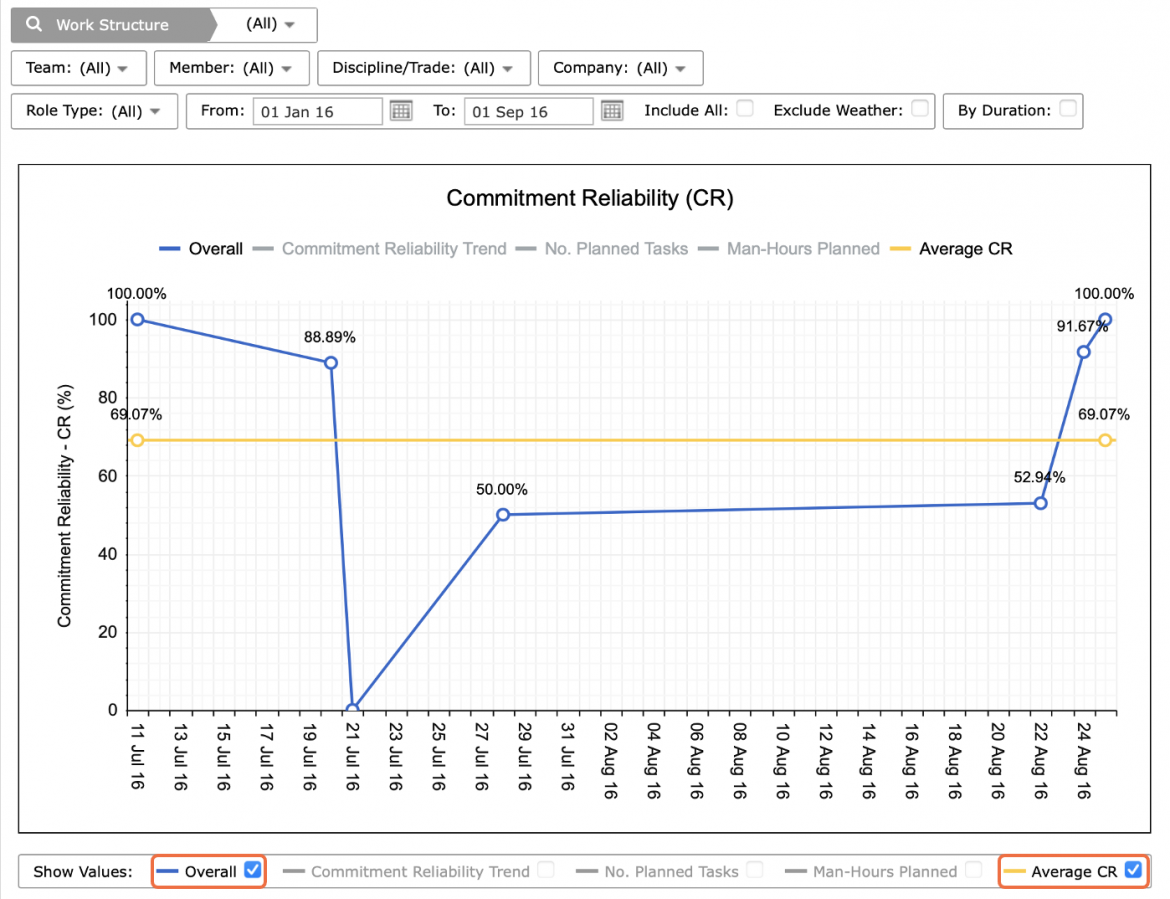
- If desired, the numerical values for all legend elements may be shown in the Commitment Reliability chart. To display these values, select the checkbox in the ‘Show Values’ section underneath the CR chart. Note that the legend element must first be activated and displayed in the chart to be able to select the ‘Show Values’ checkbox for that legend element.
- Note that the current CR for any given Production Plan is calculated based on only those tasks that have been statused. For example, assume a Production Plan for 14 June had 10 tasks of which: 7 were completed, 1 not completed, and 2 unstatused. The current CR would be calculated as: 7 / 8 = 87.5%.
When an unstatused task is later updated as Completed, you are required to enter the completion date of the task. If this completion date falls within the time frame for the Production Plan, the task is considered to be Completed as Planned in terms of CR. If the completion date is later than the date the Production Plan is closed out, the task is Not Completed as Planned.
For example, looking at the aforementioned 14 June Production Plan, assume that on 16 June, 1 unstatused task was updated with a completion date of 14 June, and the other unstatused task was updated with a completion date of 16 June. After all tasks have been statused, the updated CR for the plan would be calculated as: 8 / 10 = 80%.
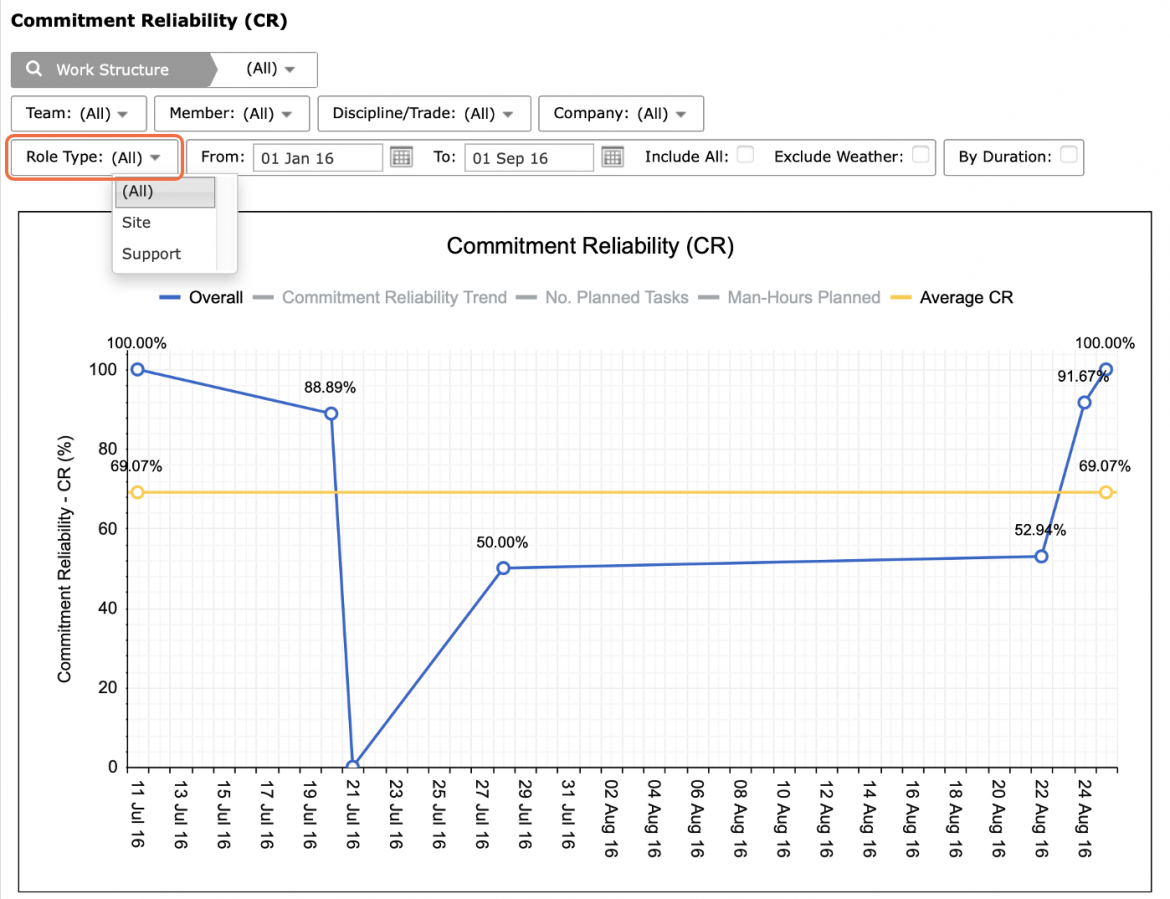
- To view the reliability for Site activities versus or Support i.e., Non-Site, activities, select the desired role under Role Type.
The distinction between Site activities and Support activities is driven by the each team member’s assigned role. For more information on roles, see Add New Member to Team / Create New User Account within Team Management. All activities belonging to a team member with a role classified either as Site or Support will factor into the reliability for the Site or Support category, respectively. Therefore, the accuracy of the data on the Commitment Reliability analytic is dependent on how well team members maintain their role information. For information on how to modify or enter role information, see Edit User Preferences within Personalization.
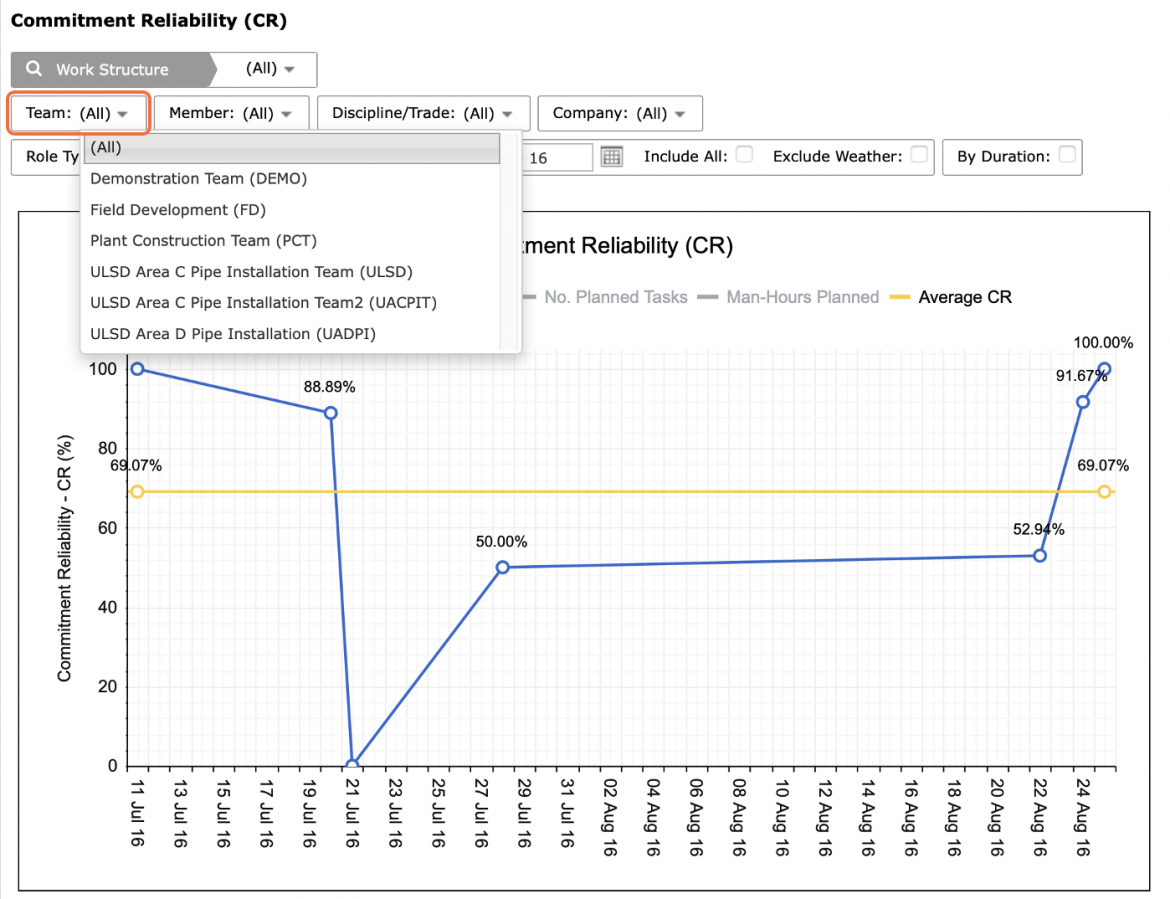
- In addition to viewing Commitment Reliability for a single team, to view an aggregate Commitment Reliability for all teams, select: All, under the Team drop-down.
This feature plots one data point for all Production Plans within the selected date range, and thus shows the overall reliability across the project over time.
- You can also filter by Member, Company, Discipline / Trade and Work Structure.
- To export Commitment Reliability to a PDF file, click the Export Graph to PDF button and follow the prompts according to the specific browser you are using.
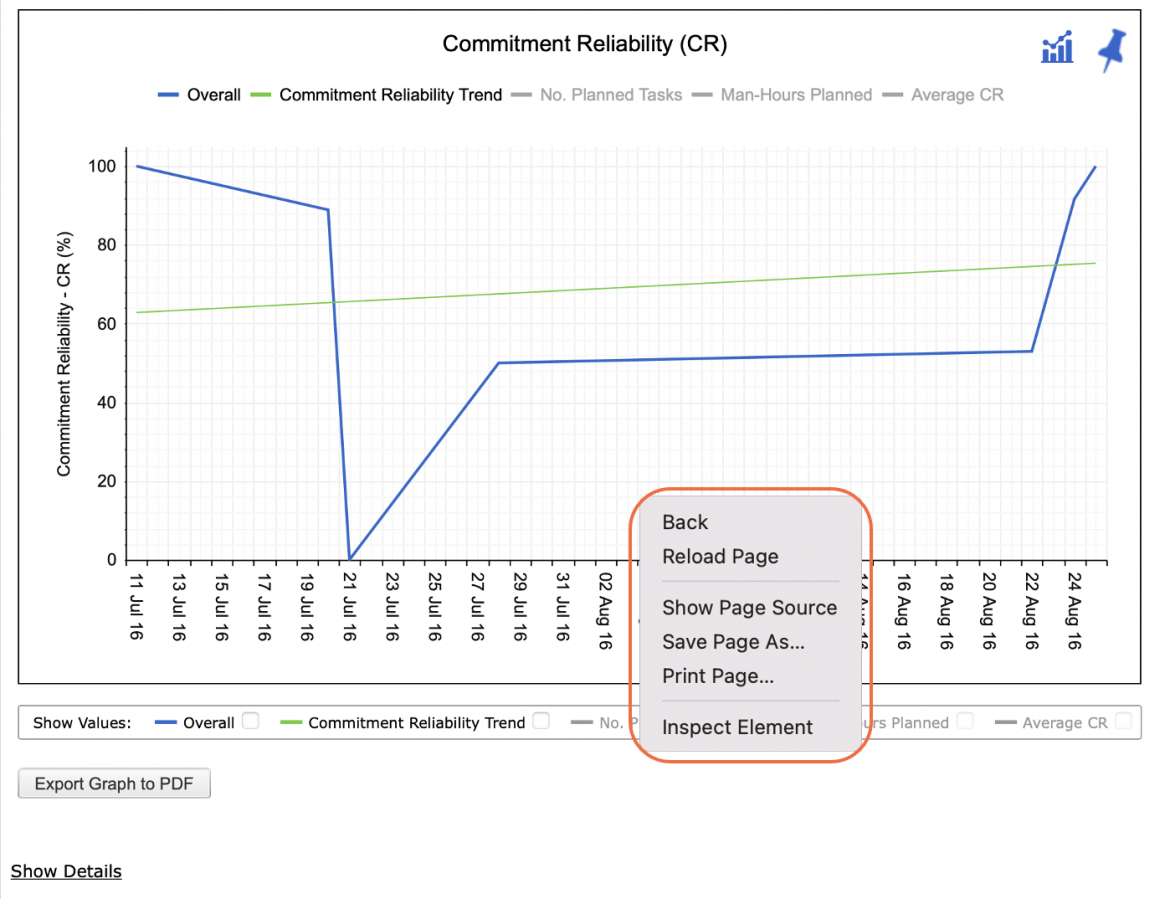
- To print Commitment Reliability, options may differ based on your browser. For instance, if you are using Safari, right-click in the white space outside of the Commitment Reliability graph and select Print Page from the menu or simultaneously press the Ctrl and P keys on your keyboard.
- The Print Dialogue box opens.
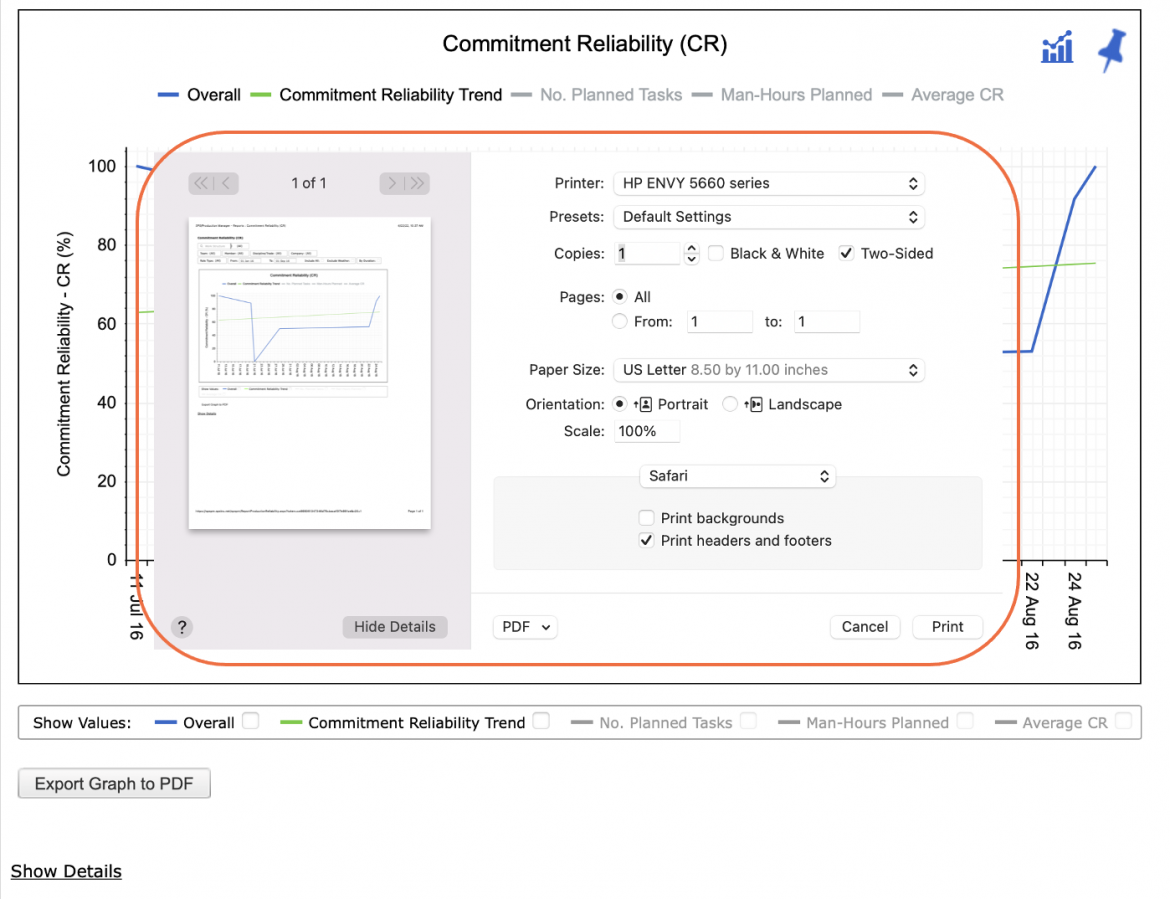
- Using the Print Dialogue box, change any desired print settings. Once all relevant printing settings have been modified, click the Print button.
Note: Before printing, it is recommended you confirm the fit to the desired paper size.