
Understanding why tasks are not completed as planned is essential to reducing variability by eliminating recurrence to the extent optimal and thereby improving the overall project performance.
Root Cause Analysis provides a log of root causes for task non-completion according to pre-defined categories and as described by those directly responsible for the work. This enables detailed analysis of individual categories for non-completion (e.g., prerequisite, capacity-labor, etc.) through access to the actual root cause description log.
Root Cause Analysis exposes root causes, rather than just symptoms for task non-completion. It has been demonstrated that capturing symptoms alone does not contribute to performance improvement. When implemented, Root Cause Analysis is connected with Production Planning because it is an opportunity to capture and expose these root causes while updating a Plan. Therefore, those in charge of leading and facilitating the update of Production Plans play a key role in exposing the right root causes by ensuring that root causes are accurately captured in SPS|PM with enough description for later analysis. There is no formula for the Root Cause Analysis, but rather it is an information log for review by those involved in Performance Improvement efforts.
Project teams should focus on identifying the three main root causes for non-completion of work in Root Cause Analysis. Once these root causes are identified, the team should determine what changes are needed to eliminate recurrence including analyzing whether standard processes are designed to eliminate root causes. The team should also determine what it expects to see when agreed changes are implemented.
To access Root Cause Analysis, complete the steps below:
- From the Main Navigation Bar select Analytics, then select Root Cause Analysis.
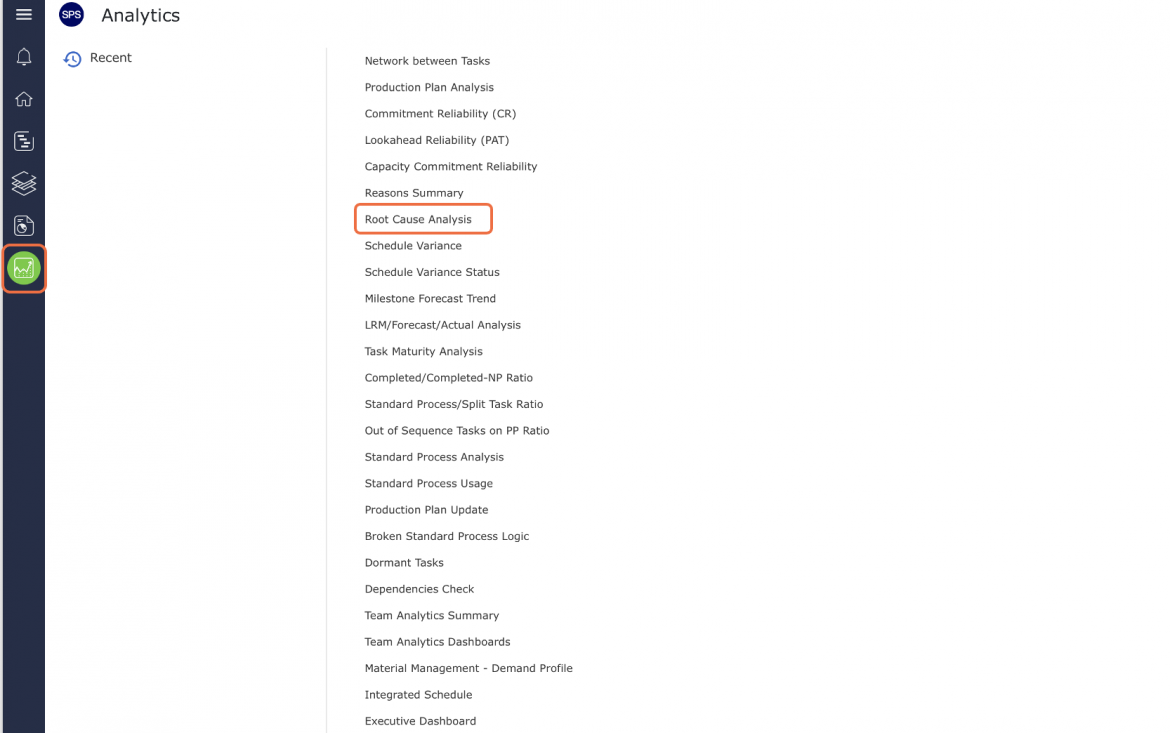
- Root Cause Analysis opens in a new window and automatically displays the Analytic for the team selected under the Team Menu with the default date range of two weeks from the current date.
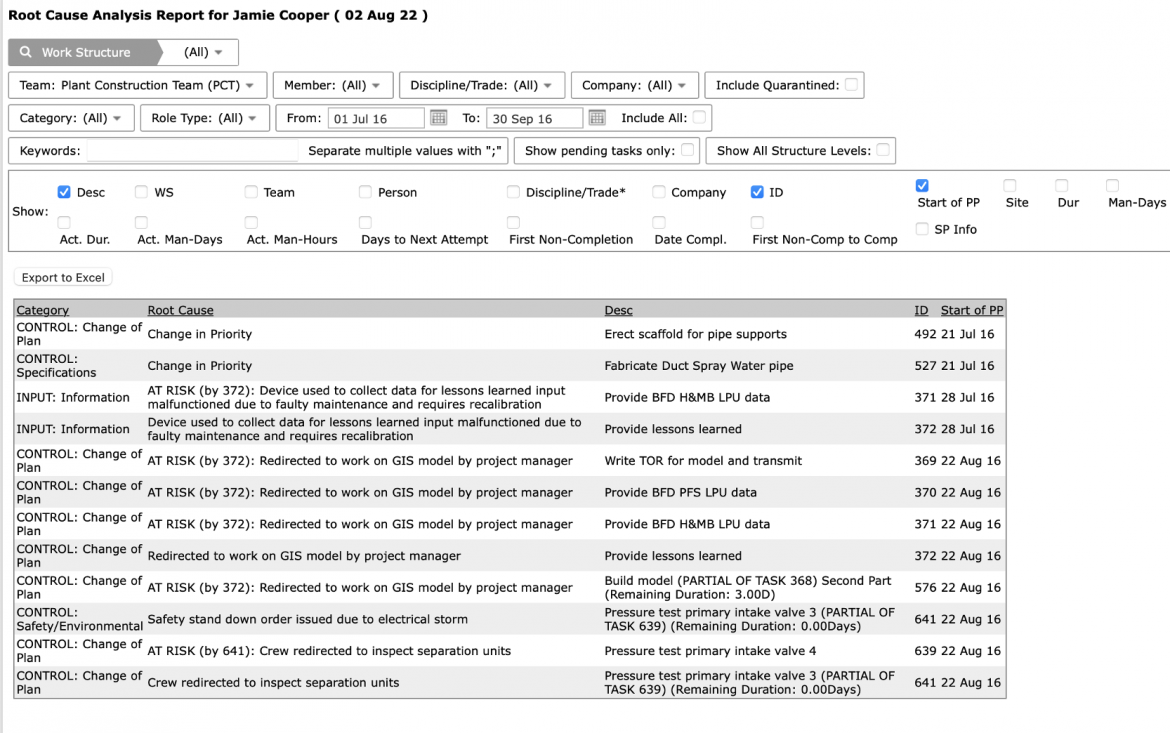
- To view Root Cause Analysis for another team, select the desired team under the Team drop-down.
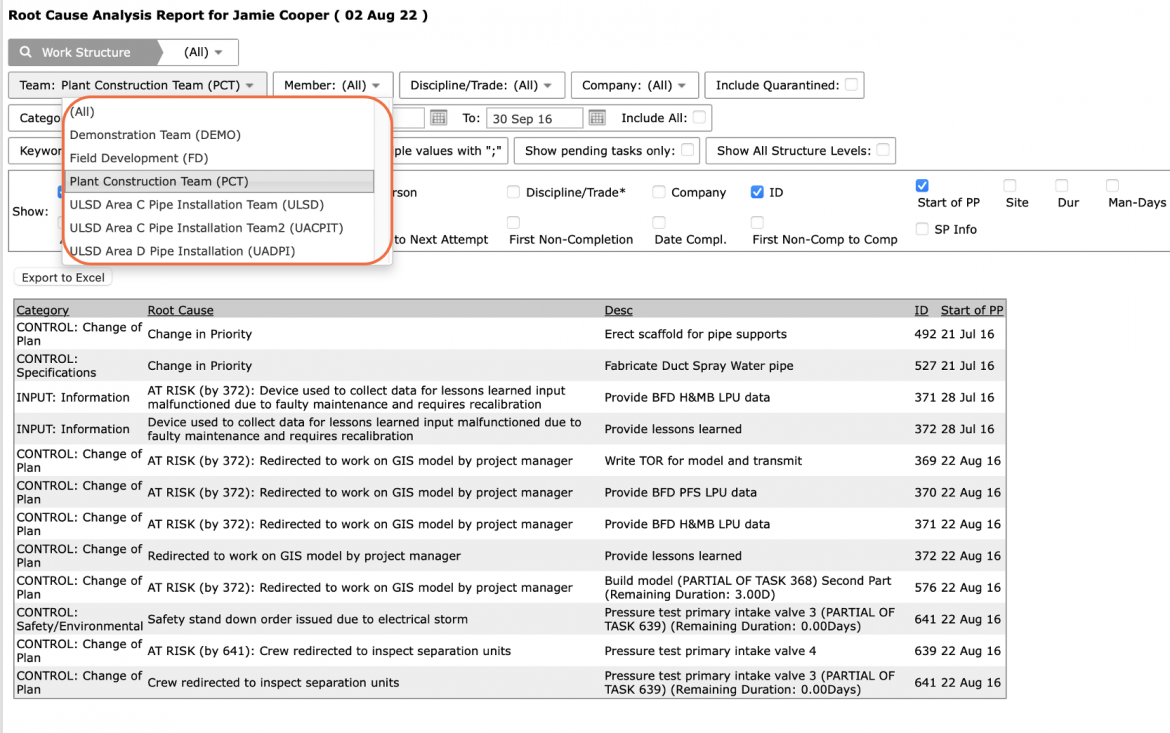
- If a different date range is desired, or no data is visible, adjust the From and To dates or check: Include All, to show all historical data.
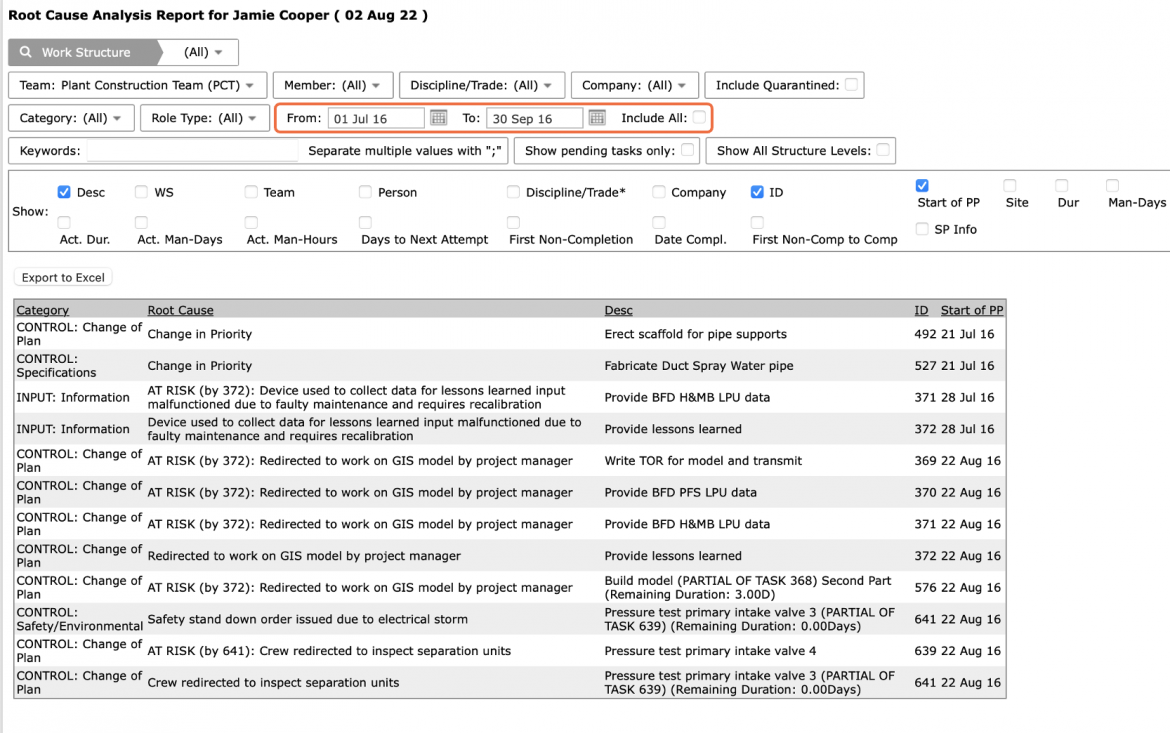
- For the selected team(s), Root Cause Analysis displays all tasks loaded on a Production Plan but not completed during the corresponding Planning Horizon for that Plan.
Each row in the Analytic represents an individual task that was not completed as planned. For each task, the root cause and category are displayed, as well as the task description, ID number, and start date of the Production Plan. Each task is also categorized as a Site activity or Support (Non-Site) activity.
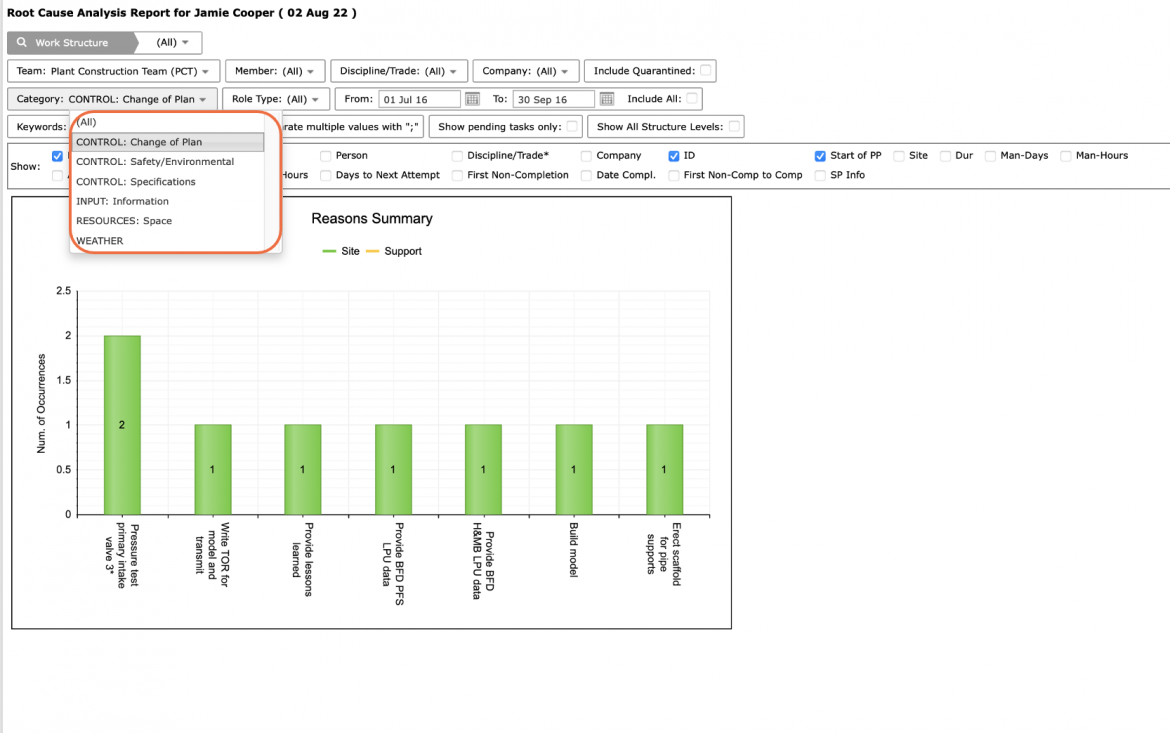
- To view the root cause for a specific category in a column graph, select the desired category from the Category drop-down.
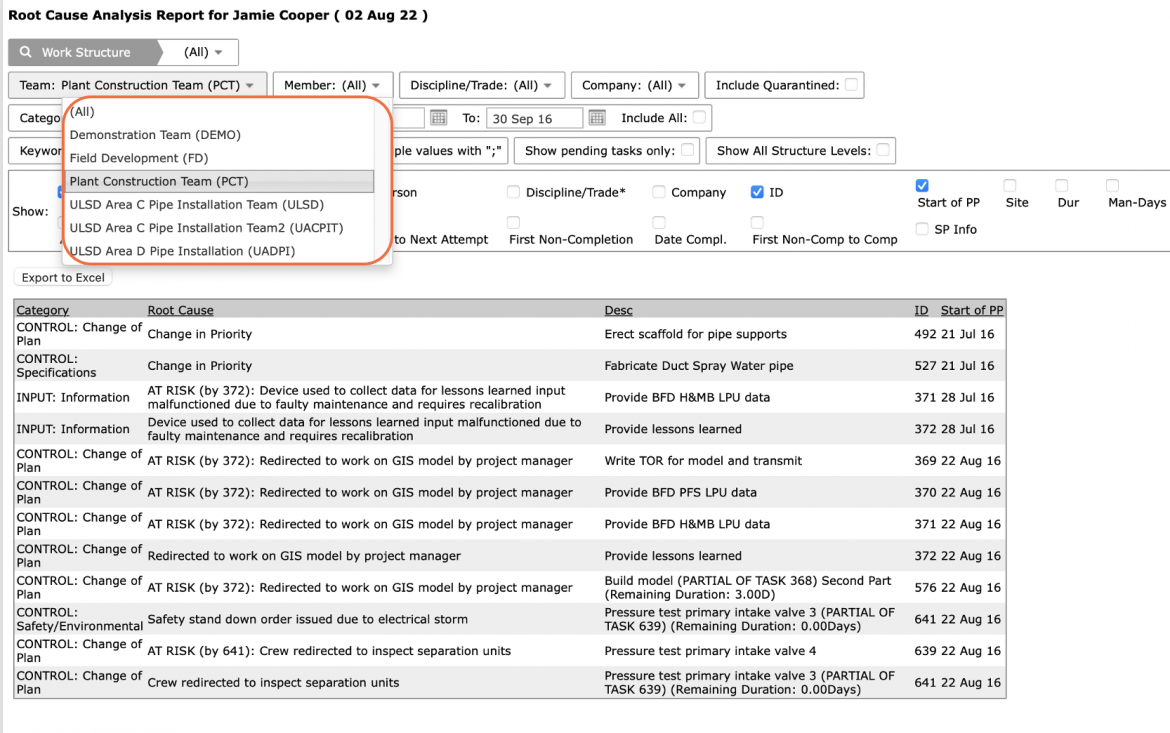
- In addition to viewing Root Cause Analysis for a single team, to view an aggregate Root Cause Analysis for all teams select: All, under the Team drop-down.
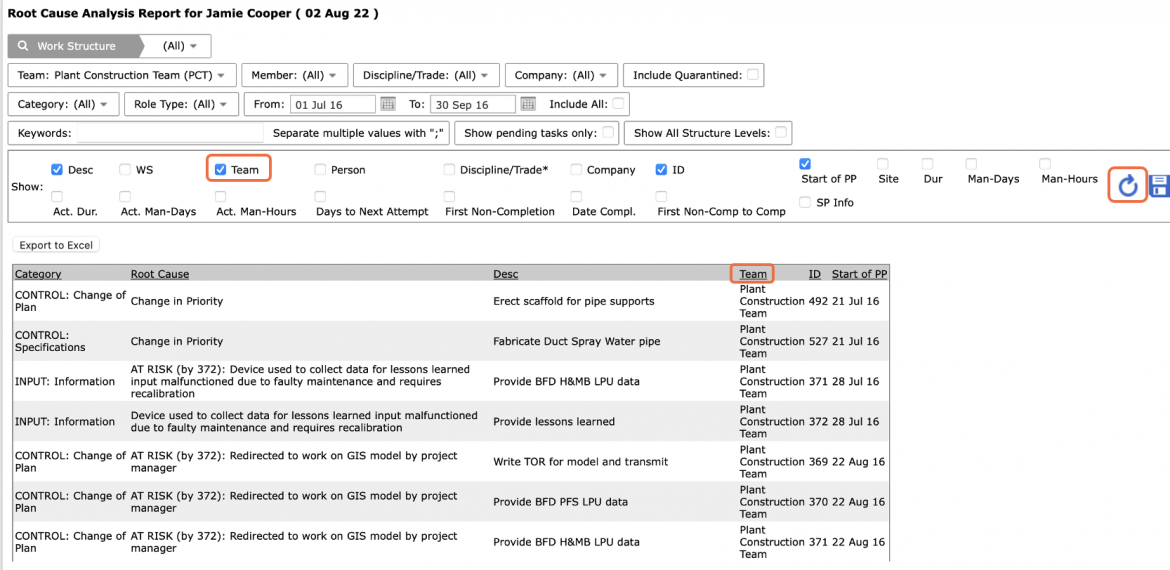
- To view the specific team associated with each root cause, or other attributes, click the Team checkbox and any additional desired attributes within Show.
Then click the Refresh button. An additional column(s) appears in the table which lists the selected attributes for each task.
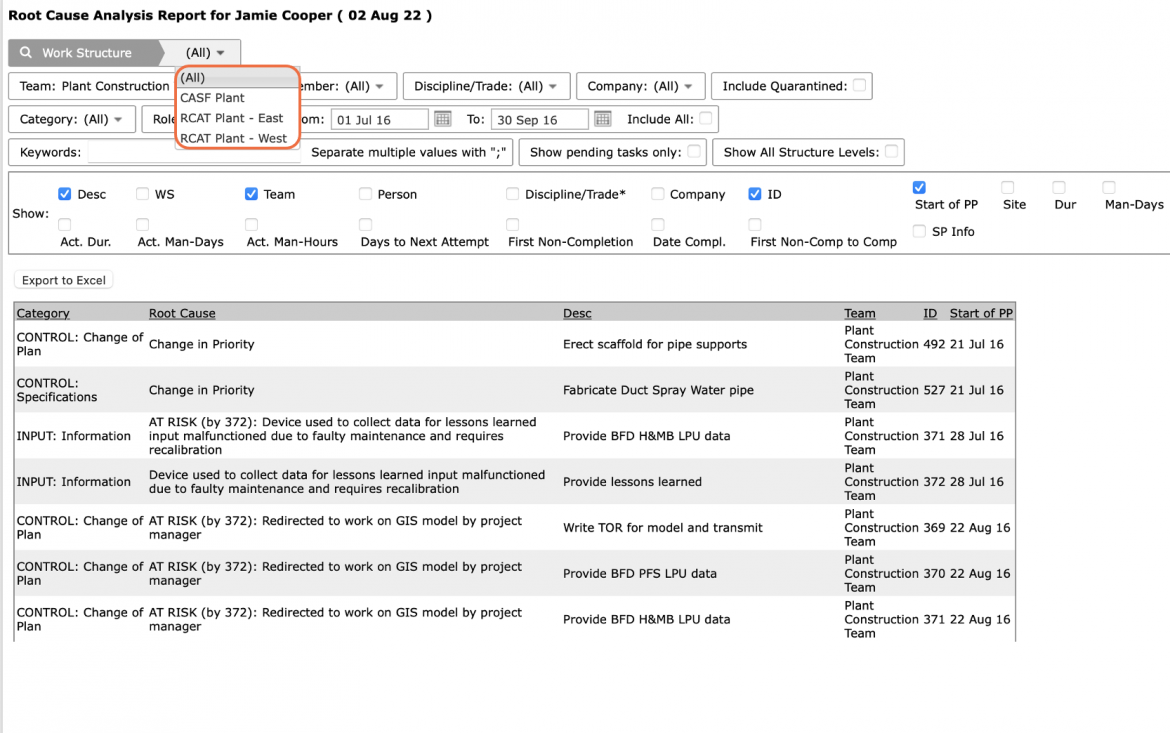
- You can also filter by Member, Company, Discipline / Trade, and Work Structure.
- To view the reasons for Site activities versus or Support i.e., Non-Site, activities, select the desired role under Role Type or click the desired role in the graph legend.
The distinction between Site activities and Support activities is driven by each team member’s assigned role. For more information on roles, see Add New Member to Team / Create New User Account within Team Management. All activities belonging to a team member with a role classified either as Site or Support will factor into the reliability for the Site or Support category, respectively. Therefore, the accuracy of the data on the Reasons Summary analytic is dependent on how well team members maintain their role information. For information on how to modify or enter role information, see Edit User Preferences within Personalization.
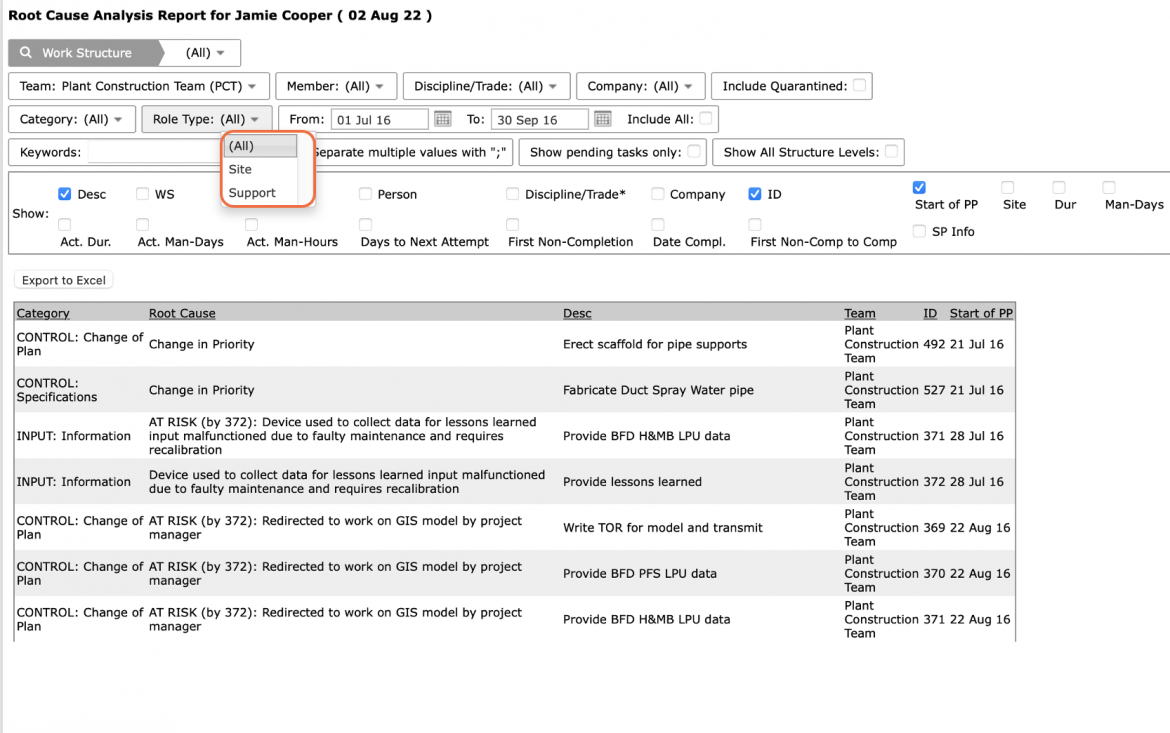
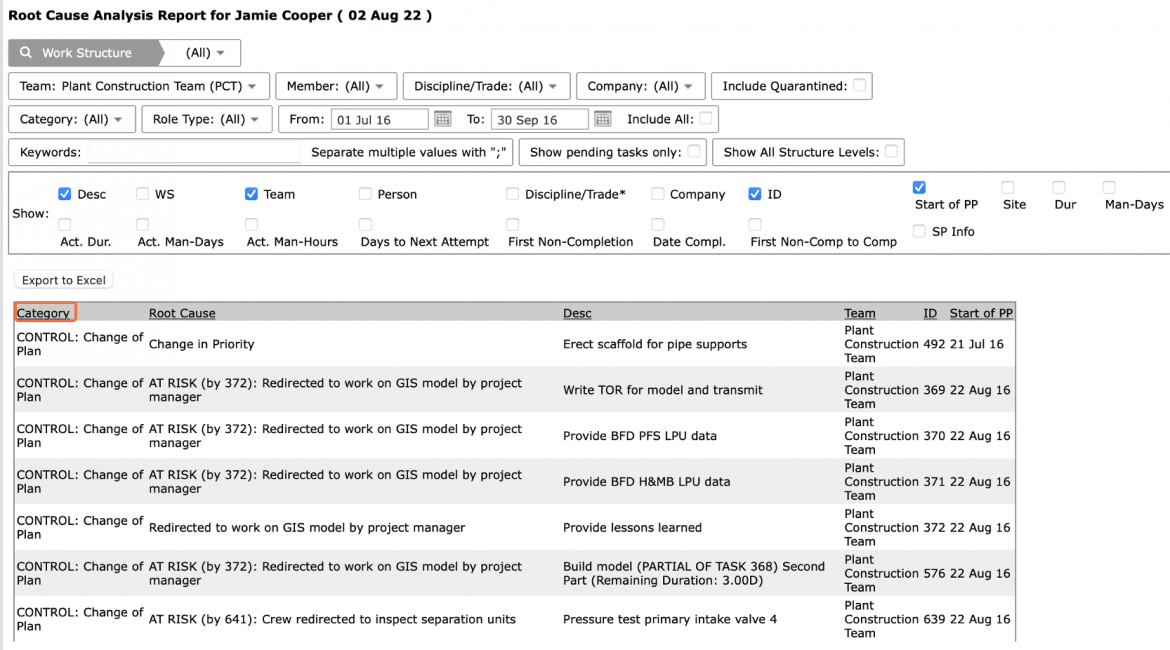
- To sort the data in the table by any of the column headings, click once on any heading to sort in ascending order. Click again to reverse the sort.
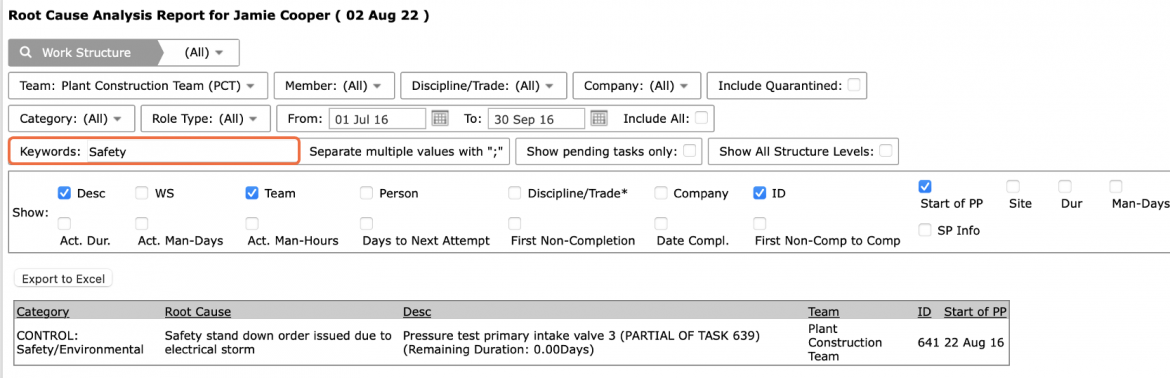
- To search for a specific root cause category, enter the desired search word in Keywords and press Return on your keyboard or click on any area of the Root Cause Analysis.
To search for multiple root causes, separate each value by a semi-colon.
- To print Root Cause Analysis, options may differ based on your browser. For instance, if you are using Internet Explorer, right-click anywhere on Root Cause Analysis and select Print from the menu or simultaneously press the Ctrl and P keys on your keyboard.
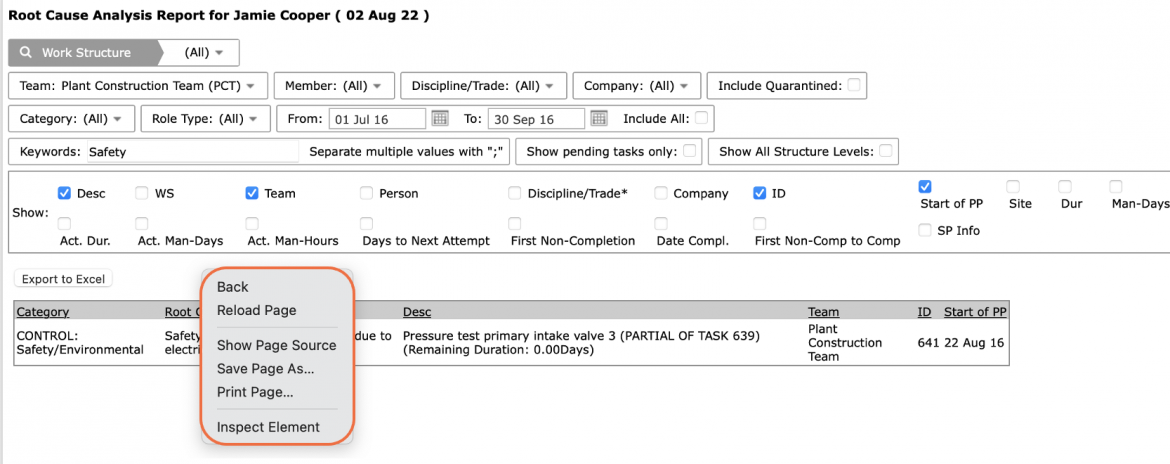
- The Print Dialogue box opens.
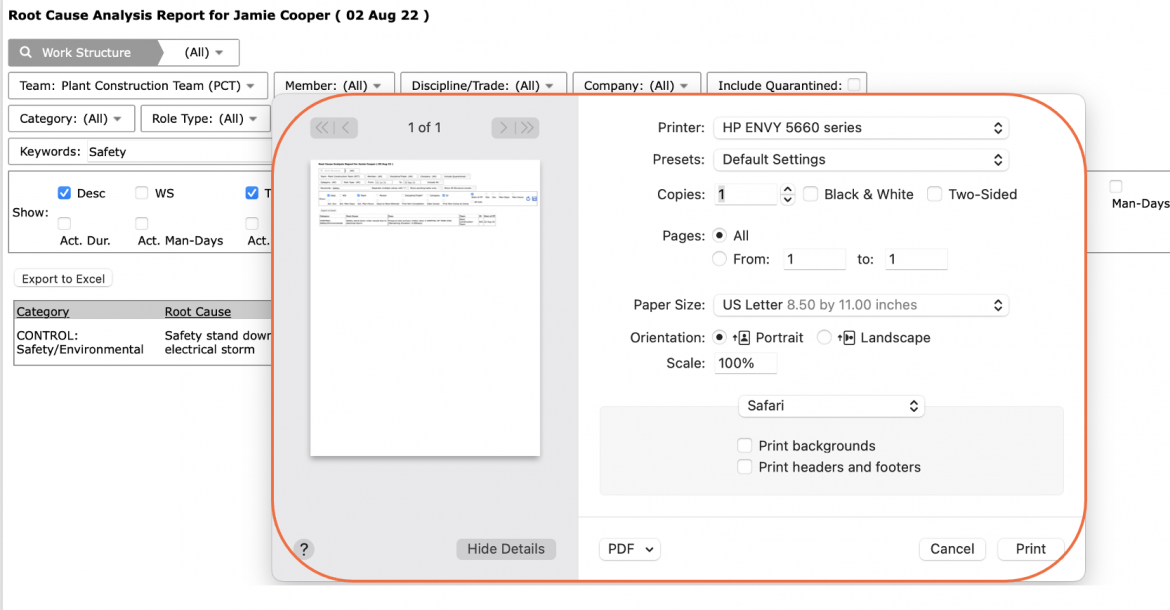
- Once all relevant printing settings have been modified, click the Print button.
Note: Before printing, it is recommended you confirm the fit to the desired paper size.